catalogs
1.1. What is GDI resource leakage?
1.2. Use GDIView tool to troubleshoot GDI object leaks.
1.3 Sometimes it may be necessary to combine with other methods to check
1.4. How to ensure that there are no GDI object leaks?
2.1 What is process handle leakage?
2.2. Thread handle leakage when creating threads
3.4. Third-party injection libraries have memory leaks, leading to processes with memory leaks
VC++ common function development summary (list of column articles, welcome to subscribe, continuously updated …)![]() https://blog.csdn.net/chenlycly/article/details/124272585C++ Software Exception Troubleshooting from Beginner to Proficient Tutorial Series (list of column articles, subscription welcome, continuously updated…)
https://blog.csdn.net/chenlycly/article/details/124272585C++ Software Exception Troubleshooting from Beginner to Proficient Tutorial Series (list of column articles, subscription welcome, continuously updated…)![]() https://blog.csdn.net/chenlycly/article/details/125529931C++ Software Analysis Tools from Beginner to Proficient Case Collection (Op-Ed, continuously updated…)
https://blog.csdn.net/chenlycly/article/details/125529931C++ Software Analysis Tools from Beginner to Proficient Case Collection (Op-Ed, continuously updated…)![]() https://blog.csdn.net/chenlycly/article/details/131405795C/C++ Fundamentals and Advancement (Op-Ed, continuously updated…)
https://blog.csdn.net/chenlycly/article/details/131405795C/C++ Fundamentals and Advancement (Op-Ed, continuously updated…)![]() https://blog.csdn.net/chenlycly/category_11931267.html In the process of C++ program development and maintenance, we often encounter resource leaks, such as GDI object leaks, process thread handle leaks, and memory leaks. Today we will discuss these types of resource leaks in depth and the methods to detect these resource leaks.
https://blog.csdn.net/chenlycly/category_11931267.html In the process of C++ program development and maintenance, we often encounter resource leaks, such as GDI object leaks, process thread handle leaks, and memory leaks. Today we will discuss these types of resource leaks in depth and the methods to detect these resource leaks.
1. GDI object leakage

On the Windows platform, do UI client-side programming, many times using the system GDI objects for window drawing, common GDI objects are Pen (used to draw lines of the brush), Brush (used to fill the color of the brush), Bitmap (used to deal with the picture of the bitmap), Font (used to set the size of the text of the font), Region (Region) , DC (Device Context) and so on.
1.1. What is GDI resource leakage?
For Pen, Brush, Bitmap and Region, etc., we need to call the interface that creates these objects to create them before using them, such asCreatePen/CreatePenIndirect、CreateSolidBrush/CreateBrushIndirect、CreateFont/CreateFontIndirect、CreateCompatibleBitmapand other API interfaces, and then after using these objects call theDeleteObjectRelease the object. For DC objects, then the general call toGetDCto get the window’s DC object, and then when not in use call theReleaseDCRelease the DC.Failure to release these objects will result in a GDI object leak.
In Windows programs, there is an upper limit on the total number of GDI objects for a process, and by default the upper limit is 10,000. This can be seen in the following registry: (Registry path: HKEY_LOCAL_MACHINE\SOFTWARE\Microsoft\Windows NT\CurrentVersion\Windows)
This value is the default value set by the system, and normally you don’t need to change it, and even if you do, you can’t change it to a very large value.
If the code segment in which the GDI object leak occurs is executed frequently, the program runs continuously for a period of time and the total number of GDI objects in the process approaches or reaches the upper limit of 10,000. When the upper limit is approached, an error occurs within the GDI drawing function that is called and returns a failure, causing the window to draw abnormally. Immediately after that, the program may crash and flashback.
1.2. Use GDIView tool to troubleshoot GDI object leaks.
Continuous leakage of GDI objects can be fatal to a program, causing it to audibly crash and flashback once it approaches or reaches its upper limit.GDI object leakage problems are relatively easy to troubleshoot.First use the GDIView tool to see which type of GDI object is leaking first:
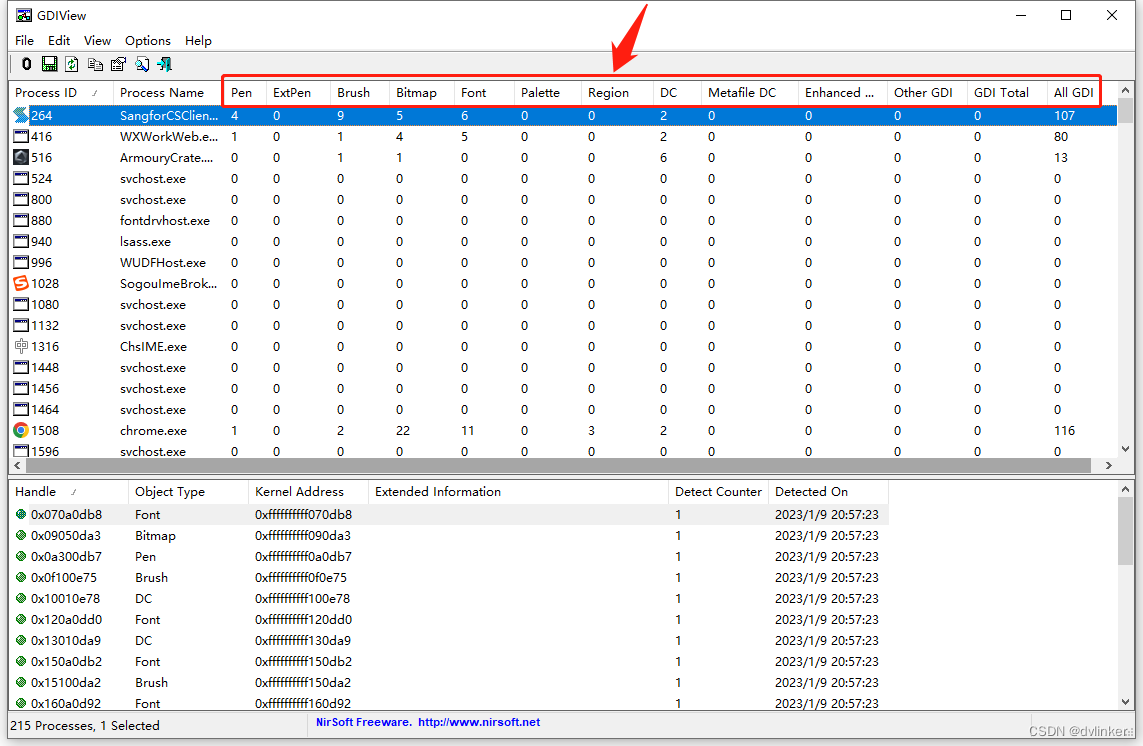
after thatTargeted view of the code that manipulates such GDI objectsThe scope of the survey is then progressively narrowed down.
If a window is drawn or displayed abnormally, or the program flashes back for no apparent reasonIf you have a GDI object leak, you can see if it is caused by the GDI object leak. You can check the value of the total number of GDI objects of the process in the task manager of Windows system: (By default, the column of GDI objects is not displayed, right-click on the title bar, and check the option of GDI objects in the pop-up window to display)
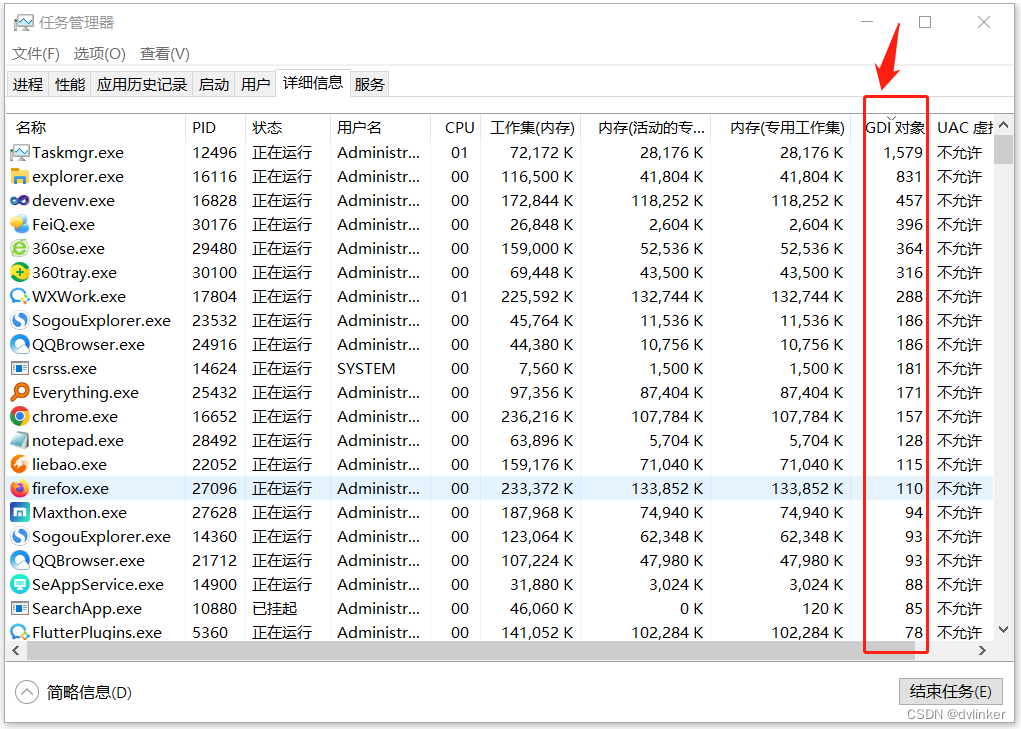
If the total number of GDI objects reaches several thousands or close to 10,000, there is definitely a GDI object leak. You can restart the program and then continuously watch the process in the task manager for changes in the total number of GDI objects.
1.3 Sometimes it may be necessary to combine with other methods to check
Sometimes it is also necessary to combine with other methods to assist in locating, for example, you can use the historical version of the comparison method, see from which day the leak started. Then look at the previous day’s code commit logs on svn or git, or the release logs for the underlying module libraries, so you can narrow down the problem quickly and efficiently.
The problem in one project was in the underlying WebRTC open source library. At that time, I looked at the UI layer code in detail and never found any leaks, so I suspected that there might be a problem with the underlying module. At that time, I found a way to reproduce the problem and thenUsing the historical version comparison method, it was determined from which date the leak started. Then looked at the code commit history on svn and the release history of the underlying librariesThe day before the problem was discovered, the underlying open source components group released a new version of the WebRTC open source library, in this version of the open source components group in order to deal with a bug, added a piece of code, and then asked the colleagues of the open source components to check the code they submitted to see if there is a GDI leak. After checking the code, they concluded that their newly added code was fine and should be triggered by other modules. However, according to the historical version comparison method, the problem should be in the WebRTC open source library, but the open source components group always felt that their code was fine.
So I went over to the Open Source Components group and looked at their code change logs on svn, and saw that there was indeed a problem with a new piece of code they had added, as shown below:
#if defined (WEBRTC_WIN)
    //Fix the mouse position problem caused by turning on DWM in the program.
    int desktop_horzers = GetDeviceCaps( GetDC(nullptr) DESKTOPHORZRES); // The problem is with this GetDC
    int horzers = GetDeviceCaps(GetDC(nullptr),HORZRES);
    float scale_rate=(float)desktop_horzers/(float)horzers;
    relative_position.set( relative_ position.x()*scale_rate,
        relative_ position.y()*scale_rate );
#endif
In this code, they call the GetDC interface to get the window’s DC object.Failure to call ReleaseDC to release a DC object after it has been used up, so it resulted in a leak of the DC object. The modified code is as follows:
#if defined (WEBRTC_WIN)
    //Fix the mouse position problem caused by turning on DWM in the program.
    HDC hDC = ::GetDC(nullptr);
    int desktop_horzers = GetDeviceCaps( hDC, DESKTOPHORZRES);
    int horzers = GetDeviceCaps(hDC,HORZRES);
    float scale_rate=(float)desktop_horzers/(float)horzers;
    relative_position.set( relative_ position.x()*scale_rate,
        relative_ position.y()*scale_rate );
    ::ReleaseDC(nullptr, hDC);
#endif
As for why the open source component coworkers didn’t find the problem, it may be due to their unfamiliarity with UI programming.
For another example of GDI object leakage troubleshooting, see my previous post:
1.4. How to ensure that there are no GDI object leaks?
To ensure that there is no GDI object leakage, the GDI object should be deleted or released after it is finished being used. For exampleThe GDI object created by using CreateXXXXXXXX, after using it, you have to use DeleteObject to release it; call LoadXXXXXX function to load image resources, after using it, you also have to use DeleteObject to release it; call DC object created by using CreateXXXXDC, after using it, you have to use DeleteDC to release it; Call GetDC to get the DC object, after use, to use ReleaseDC to release.
Different interfaces are called to create or get GDI objects, and the corresponding release interfaces are called when releasing them, so there is no confusion! I’ll give you a rough list here:
| Create or get GDI objects | Deleting or releasing GDI objects |
| CreatePen/CreatePenIndirect (pen brush object), CreateSolidBrush/CreateBrushIndirect (brush brush object), CreateFont/CreateFontIndirect (Font font object), CreateCompatibleBitmap (BItmap bitmap object) | For objects created from Create, call theDeleteObjectliberate (a prisoner) |
| CreateDC/CreateCompatibleDC (create DC object) | call (programming)DeleteDCliberate (a prisoner) |
| GetDC (Get DC object) | call (programming)ReleaseDCliberate (a prisoner) |
| LoadBitmap (Load Bitmap Bitmap) | call (programming)DeleteObjectliberate (a prisoner) |
| LoadImage (load image resources) | If a Bitmap bitmap is loaded, call theDeleteObjectRelease; If the Cursor cursor is loaded, call theDestroyCursorRelease; If an Icon icon is loaded, call theDestroyIconRelease. |
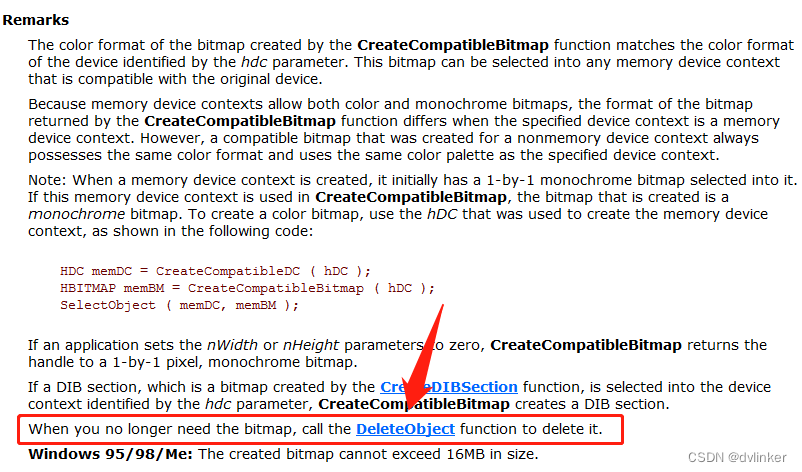
For the API function mentioned above to create GDI objects, which interface should be called when releasing, you can go directly to MSDN to check the Remarks section of the API interface will find the corresponding instructions. For example, the API function CreateCompatibleBItmap, which creates a compatible bitmap, is described in the Remaks section as follows:
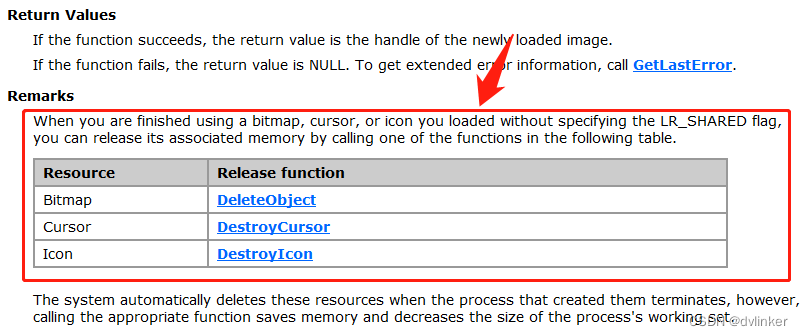
Another example is LoadImage, the API function for loading images, which is described in the Remarks section as follows:
When you encounter problems with calling Windows system API functions, you need to go to the Microsoft MSDN help page for detailed descriptions of the API functions (It may give precautions when calling a function, or sample code for calling a function, etc.), you may find the reason for this in the description! Being able to use MSDN is the most basic requirement for a Windows developer!
2. Process handle leakage
Process handles includefile handle(handle generated when opening the file),registry handle(handle generated when opening a registry node),event handle、semaphore handle、thread handle(the handle generated when the thread was created),process handle(handles generated when creating child processes), etc.
2.1 What is process handle leakage?
suchHandles need to be released promptly after use, if not, they can cause handle leakage。Generally, you call CloseHandle to release handles, such as process handles, thread handles, event handles, file handles and so on. Of course, there are also some handles that need corresponding interfaces to release, such as registry handles need to call RegCloseKey to close.
In Windows, there is an upper limit to the number of process handles, which is 10000 by default, and there is also a corresponding registry entry. When the number of handles of a process is close to or reaches the upper limit of 10000, it will lead to the failure of subsequent operations that generate handles, such as calling CreateThread to create a new thread will fail. The path to the registry setting for the upper limit of process GDI objects is:
HKEY_LOCAL_MACHINE\SOFTWARE\Microsoft\Windows NT\CurrentVersion\Windows
Not only is there an upper limit on the process’s GDI objects, the process’shandleThe number (e.g., handles such as thread handles, event handles, etc.) is also capped, and the default is also 10,000. The corresponding nodes in the registry are configured as follows:
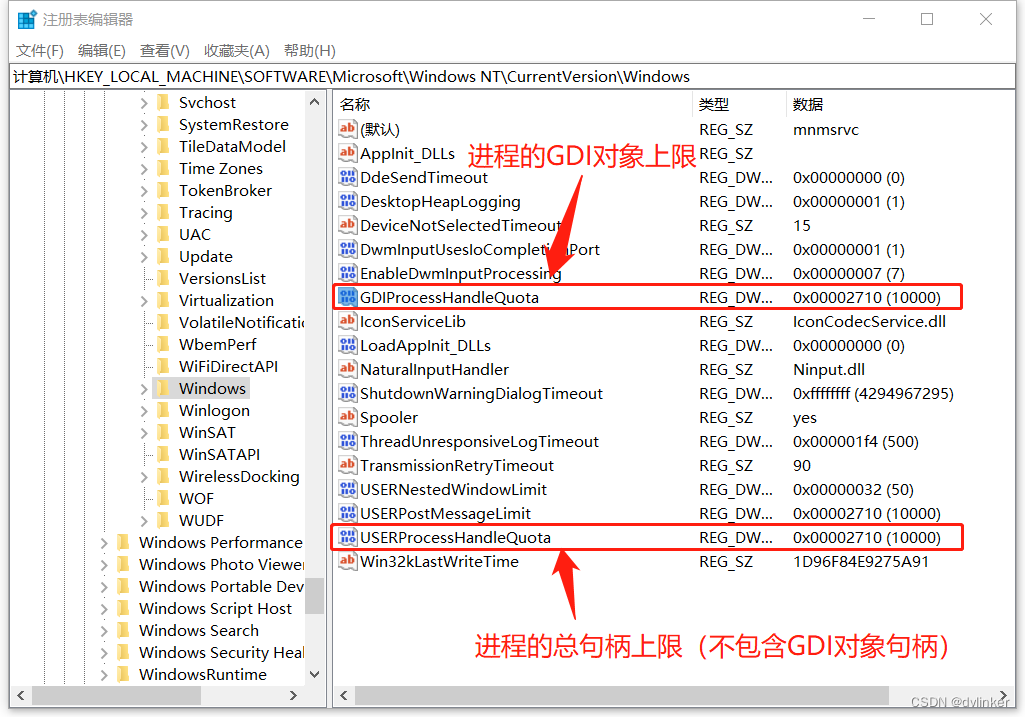
These two configuration items are described below:
1) Item GDIProcessHandleQuota: Set the number of GDI handles, the default value is 2710(hex)/10000(decimal), the allowable range of this value is 256 ~ 16384 , adjust it to a value greater than the default of 10000. If your system is configured for 2G or more, you may wish to set it to the maximum allowed value of 16384(decimal).
2) USERProcessHandleQuota entry: Set the number of user handles to the same default value of 2710(hex)/10000(decimal), which has an allowable range of 200 ~ 18000, and adjust it to something more. Similarly, for systems with 2GB or more of physical memory, you may wish to set the number of user handles directly to the upper limit of 18000 (decimal).
2.2. Thread handle leakage when creating threads
In the past, we have encountered such a problem in the project, some business subsystems are interacting with the platform server through https, and the client will create a thread to execute every https operation, but after creating the thread, the client will not be able to execute the operation.Failure to call CloseHanlde to close out the thread handle, resulting in thread handle leakage,When multiple https operations result in too many thread handles, the subsequent thread creation fails, resulting in an exception in the subsequent operation.。
You can go to Process Explorer to see what specific handles the processes are occupying:
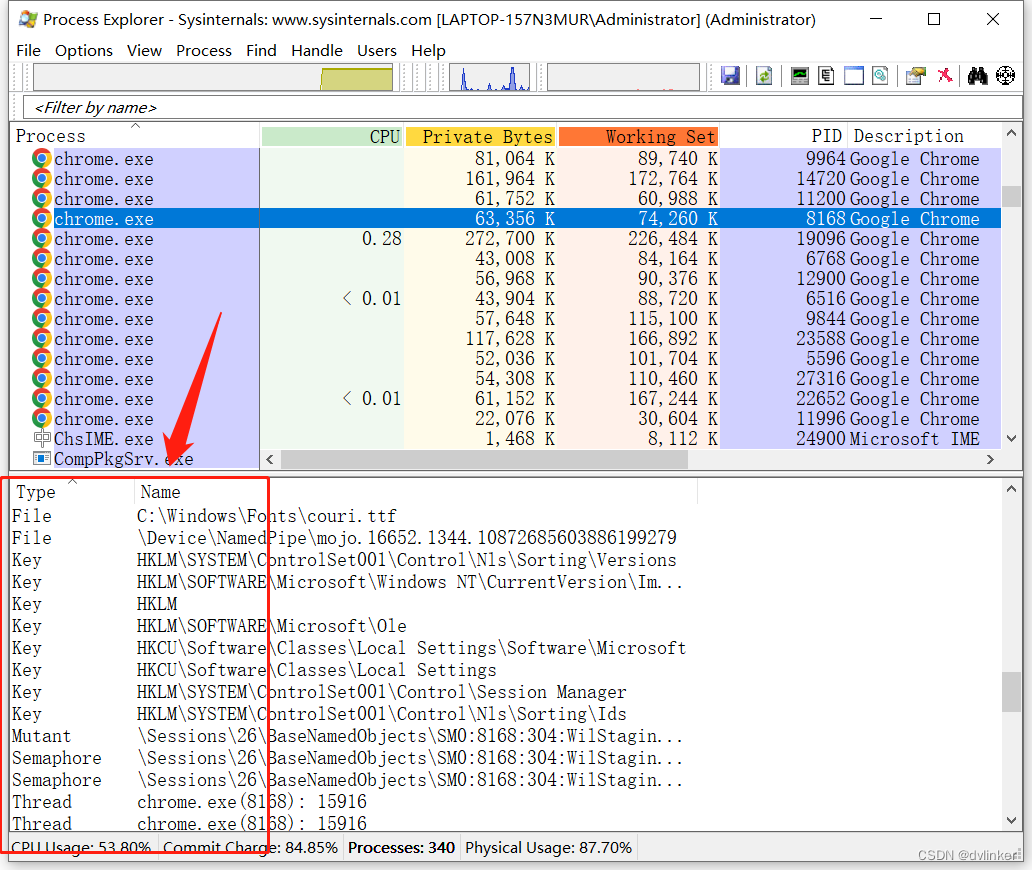
This is a good place to note that the call to CloaseHandle releases the thread handle:
HANDLE hThread = ::CreateThread( NULL, NULL, ProcessProc, this, NULL, NULL );
if ( hThread != NULL )
{
	CloseHandle( hThread );
}
Call CloseHandle to free the handle andIt does not mean that the thread is terminated. Whether the thread is terminated or not depends on the thread function, and the thread is terminated when the thread function exits.
The thread is finished, and the thread handle is not automatically closed. For thread functions, there is another detail, the CreateThread function that initiated the creation of the thread returns, it does not mean that the thread’s code has been executed into the thread function. We have encountered this type of scenario in our projects. The problem scenario was that a pointer variable was accessed in the thread function, and the operation to initialize the value of the pointer variable to NULL was placed after the CreateThread function was called, as shown below:
// 1. Pointer variable definitions
CVideoDec* g_pVideoDec;

// 2. Creating threads
HANDLE hThread = ::CreateThread( NULL, NULL, ProcessProc, this, NULL, NULL );
if ( hThread != NULL )
{
    CloseHandle( hThread );
}
g_pVideoDec = NULL; // initialize the pointer variable


// 3. A threaded function, which accesses the pointer variable g_pVideoDec
DWORD WINAPI ProcessCachedMsgThreadProc( LPVOID lpParameter )
{
      // The pointer variable is accessed in a threaded function.
      g_pVideoDec->StartDec();
      return 1;
}
Of course, this practice is not standardized, and later found that the program will crash from time to time in the thread function, the use of Windbg analysis down to learn that the thread access to the uninitialized variables, but this problem is not necessarily present. This does not have to appear, and CreateThread function to return to the thread after the thread is executed in the thread function.
Sometimes, when CreateThread returns without having executed into the thread function, it will not crash to initialize the value of the pointer variable immediately after. However, if CreateThread returns with a thread function already executed, it accesses the uninitialized pointer variable, and the uninitialized memory under Release is a random value, i.e., the value of the pointer variable is a random value, so an exception is usually thrown.
3. Memory leakage
Memory leaks are a typical class of memory problems that tend to occur when C++ programs use dynamically requested memory. There are various ways to dynamically request memory, such as using thenew(To be useddeleteto release), such as usingmalloc(To be usedfree(to release it), and then for example, calling the system API functionHeapCreateorHeapAlloc(To be usedHeapFree(to release it), there are also API functions that can be calledVirtualAlloc(To be usedVirtualFreeto release), and of course other API functions.Dynamically requested memory that is not freed results in a memory leak.
The reason for the memory leak.Probably forgot to release it.,It is also possible that the code to free the memory was written, but for one reason or another the code to free the memory was not executed,There is a certain amount of secrecy in the latter category. We focus on the latter type of situation below.
3.1. After calling the interface, the object created in the interface or the dynamically requested heap memory is not released.
When calling some interfaces, if the interface will Create an object and return the object (address) as the return value of the function to the external use, the external use of the object, you need to manually destroy the object.
In addition to the C++ class object, you may call an interface that returns a buffer address, which corresponds to memory that needs to be freed externally, which you need to be aware of when calling the interface. If the returned object or buffer is not destroyed externally, it will lead to a memory leak.
For example, if we call the FromHBITMAP interface of the Bitmap class in the GDI+ library and pass in a bitmap handle, the interface memory will automatically create (construct) a Bitmap object and return the address of the object for external use. Because this Bitmap object is dynamically created, you need to delete it after use, as shown below:
Bitmap *pSrcBmp = Bitmap::FromHBITMAP( hBmp, NULL );

//...  // Processing code omitted

delete pSrcBmp; // destroy the dynamically created Bitmap object inside the Bitmap::FromHBITMAP interface
Failure to do so will result in leakage.
Why do you need to destroy the Bitmap :FromHBITMAP interface is only responsible for constructing a Bitmap object to return to the external use, the interface is not responsible for the destruction of the object, the interface does not know how long the external use, only the user to destroy the object.
3.2. In polymorphism, the parent class destructor is not declared as a virtual function, resulting in the destructor of the subclass not being executed.
For example, the following polymorphic code:
class CBase
{
public:
    CBase();
    ~CBase(); // not setting the parent class destructor to virtual
}

class CDerived : public class CBase
{
public:
    CDerived();
   ~CDerived();
}

// Assigning a new subclass object to a pointer to the parent class is polymorphic.
CBase* pBase = new CDerived;
// ...  // Intermediate code omitted
delete pBase;
The above code, asNot setting the parent class’ destructor ~CBase as a virtual function, resulting in the execution of delete pBase; without calling the destructor of the subclass, resulting in part of the memory of the subclass not being freed, thus triggering a memory leak.Especially newcomers are more likely to make this kind of mistake, which I’ve encountered before while helping newcomers troubleshoot problems, the memory leak in this scenario is somewhat insidious.
If it’s not a destructor, it’s some other member function, and if the interface of the parent class is not declared as virtual, polymorphism won’t take effect, which will lead to the member function rewritten by the subclass won’t be executed to the subclass rewritten member function may contain important business code, which will result in the important business code not being executed to the subclass, leading to business exceptions.
Newcomers on our side have encountered this before when porting code to a localized machineThe newcomer forgot to add a virtual declaration in front of the interface of the parent class, which caused the catch button of the subclass could not be executed, resulting in abnormal business, at that time, he did not find out the problem for a long time, and then he asked me to troubleshoot the problem, and found this reason, so I am very impressed with this problem!
So.When we define a C++ class that may be inherited, we generally have to set the parent class’s destructor function to be a virtual functionIn order to prevent the above polymorphic scenario, the destructor function of the subclass cannot be executed, which leads to memory leakage. Of course, there are some side effects of setting up a virtual function. If a class contains a virtual function, a pointer to the virtual function table will be added to the class automatically, and there is also the problem of secondary addressing (which has a slight impact on the efficiency) when the virtual function is called.
3.3. Cyclic references occur when using the smart pointer shared_ptr, leading to memory leaks.
The use of shared_ptr may suffer from circular reference problems, a typical problem with the use of shared_ptr smart pointers (Also an interview question about shared_ptr smart pointers), the scenario is that both classes contain shared_ptr objects pointing to each other, which would cause the two classes that are newly created to not go through destructuring, triggering a memory leak problem.
The circular reference problem is illustrated below:
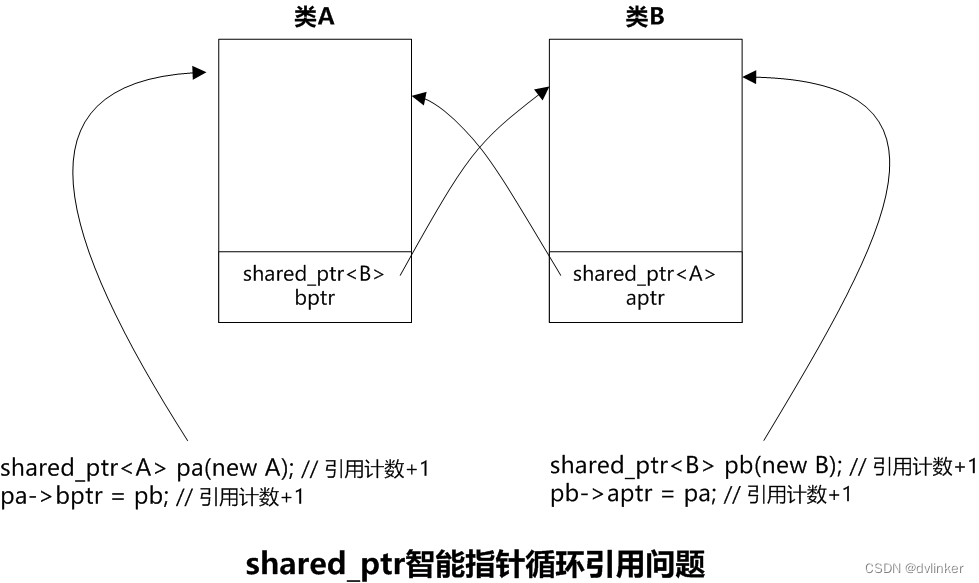
The relevant codes are listed below:
#include <iostream>
#include<memory>

using namespace std;

class B;
class A{
    public:
    shared_ptr<B> bptr;
    ~A(){cout<<"~A()"<<endl;}
}

class B
{
    public:
    shared_ptr<A> aptr;
    ~B( ){cout<<"~B()"<<endl;}
}

int main() {
    shared_ptr<A> pa(new A()); // references plus 1
    shared_ptr<B> pb(new B()); // references plus 1
    pa->bptr = pb; // references plus 1
    pa->aptr = pa; // references plus 1
    return 0;
}
When the above return 0 code is executed, the reference counts of the objects A and B are both 2. When the main function is exited, the shared_ptr<B> pb object will be destructed first, the reference count of the B object will be reduced by 1, and the reference count of the B object will still be 1, so the B object won’t be deleted, and it won’t be entered into the destructor function of the B object, and the shared_ptr<A> aptr member of the B object won’t be destructed, and the reference count of the A object will still be 2 at this time. ptr<A> aptr member of class B will not be destructed, so at this time the reference count of object A is still 2. When destructing shared_ptr<A> pa, the reference count of A is decremented by 1, and the reference count of object A becomes 1, so object A will not be destructed. So the above code will result in both A and B new objects are not released, resulting in a memory leak.
To solve the above problem, weak_ptr was introduced, which allows you to replace the shared_ptr member contained in a class with a weak_ptr, as follows:
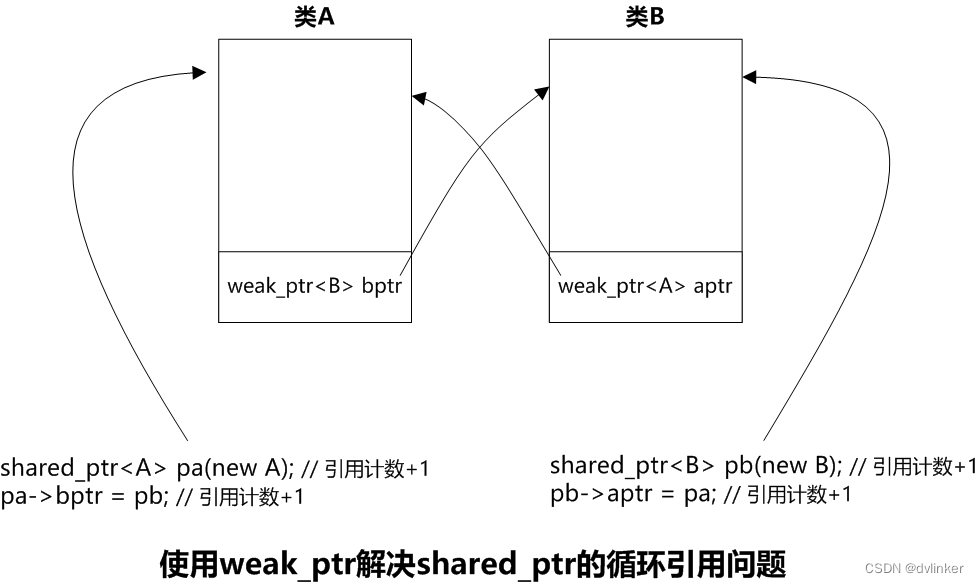
The relevant codes are listed below:
#include <iostream>
#include<nemory>

using namespace std;

class B;
class A{
    public:
    weak_ptr<B> bptr; // use weak_ptr instead of shared_ptr
    ~A(){cout<<"~A()"<<endl;}
}

class B
{
    public:
    weak_ptr<A> aptr; // use weak_ptr instead of shared_ptr
    ~B( ){cout<<"~B()"<<endl;}
}

int main() {
    shared_ptr<A> pa(new A());
    shared_ptr<B> pb(new B());
    pa->bptr = pb;
    pa->aptr = pa;
    return 0;
}
3.4. Third-party injection libraries have memory leaks, leading to processes with memory leaks
There are two typical scenarios in which a third library is injected into our program process.Input method module injectionOne isInjection of third-party security softwareThe input method has to support text input from all processes. Input method to support all processes of text input, formally injected into all processes through the remote module to sense the user’s input. Third-party security software, in order to monitor the data operation of the software, usually also need to be injected into the process remotely.
In previous projects, we have encountered a memory leak in the injection module of a third-party security software, which caused the process to run out of memory and triggered the program to flashback. For this kind of problem, other software may not trigger memory leakage, only our software will trigger memory leakage, we need to produce enough evidence to prove that the memory leakage is caused by the injection module of the third-party security software, otherwise the customer will think that it is our software’s problem, because other software is fine, the customer may not recognize that it is related to the third-party security software. The cause of the problem at that time was that there was a memory leak in the code of the third-party security software that handles UDP data monitoring, because our software has a large amount of audio and video data sent and received, which goes by UDP, so it triggered the memory leak in the injection module of the third-party security software. After giving enough evidence, the customer found the third-party security software provider, and then the security vendor fixed the bug.
3.5. Hazards of Memory Leaks
If a memory leak occurs, the code will not be executed frequently, but only occasionally, without causing much problem.However, if code with memory leaks, is executed frequently, it will leak frequently (memory is not freed) and may eventually cause the process to run out of memory, triggering an Out of memory crash.
When a process starts, the system will allocate a specified size of virtual memory to the process. Take a 32-bit program for example, the system will allocate 4GB of virtual memory, including 2GB of user-state virtual memory and 2GB of kernel-state virtual memory. Generally, memory leakage code is in the user-state, so a continuous memory leakage will lead to the exhaustion of the user-state virtual memory, triggering an Out of memory crash. Of course, for 64-bit programs, a large enough virtual memory will be allocated. However, the user’s computer may not be turned off for many days, and the software has been running continuously, so if there is a continuous memory leak, there will always be a day when the memory is exhausted.
We can use the task manager that comes with Windows:
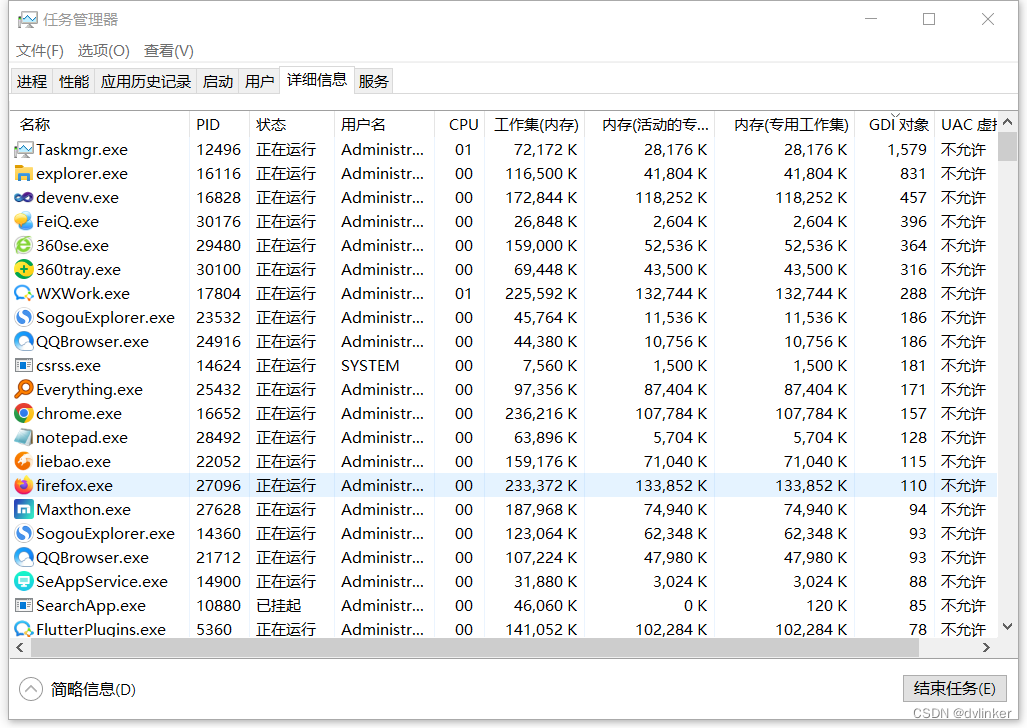
Go ahead and continuously observe the memory changes of the target process, if the memory continues to grow without falling back, there may be a memory leak.
In addition, the task manager that comes with Windows does not see the total virtual memory usage of the processes and can be used with theProcess Explorertool to see the total virtual memory occupied by the process. Note that the tool shows the virtual memory occupied by the user state:
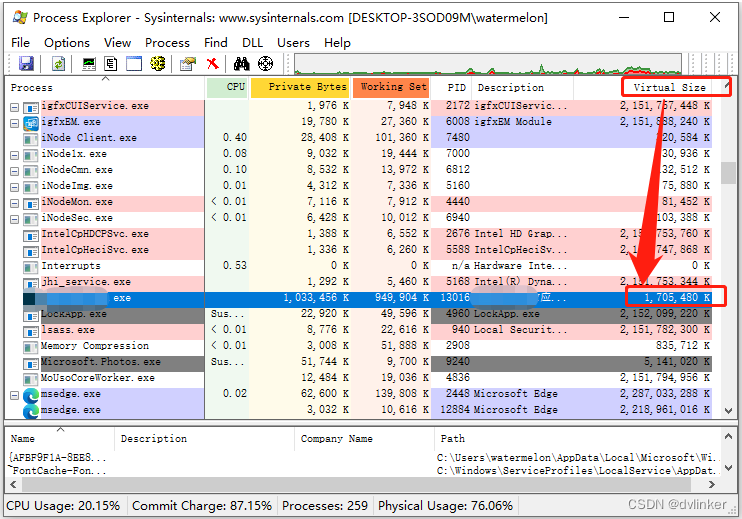
We generally only need to focus on user-state virtual memory, because business code occupies user-state virtual memory.
Our program is 32-bit, the system allocates 4GB of virtual memory to the process, of which the user state virtual memory accounts for 2GB, the kernel state virtual memory accounts for 2GB, from the above chart, the current program process user state virtual memory occupies up to 1.7GB, already close to the upper limit of 2GB, and may be running for a while, 2GB user state memory will be depleted, and the program will flashback!
Note that the Process Explorer tool by default does not display theVirtual Sizecolumns, you need to right-click the title bar of the process list, click “Select Columns”, click the “Process Memory” tab in the pop-up window, and then set the ” Virtual Size” option:
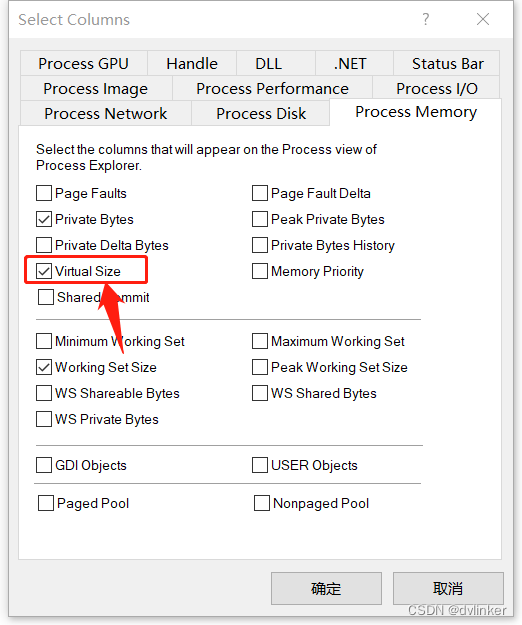
3.6. Memory Leak Detection
Troubleshooting memory leaks is relatively tricky, but there are tools you can use to analyze them.
3.6.1 Troubleshooting memory leaks on Windows platforms
On Windows platforms, you can use theWindbg(using the !heap command),umdh.exe(The tool is located in the Windbg installation directory),DebugDiag、VMMAPand Visual C++-specificVisual Leak Detectorand other tools. For the Visual Leak Detector tool, the relevant libraries need to be compiled into the module. For several other tools, they can be used directly.
For more information on how to use the umdh.exe tool to detect memory leaks, see my previous article:
Using Windbg to locate memory leaks in Windows C++ programs https://blog.csdn.net/chenlycly/article/details/121295720![]() https://blog.csdn.net/chenlycly/article/details/121295720 For more information on how to go about troubleshooting using the Visual Leak Detector tool, see the article I wrote earlier:
https://blog.csdn.net/chenlycly/article/details/121295720 For more information on how to go about troubleshooting using the Visual Leak Detector tool, see the article I wrote earlier:
Troubleshooting Memory Leaks with Visual Leak Detector![]() https://blog.csdn.net/chenlycly/article/details/133041372 Memory leaks are not so easy to locate, nor are theyThe above tools may only be able to detect memory leaks in certain scenarios, so if you can’t detect them using one tool, try using another.
https://blog.csdn.net/chenlycly/article/details/133041372 Memory leaks are not so easy to locate, nor are theyThe above tools may only be able to detect memory leaks in certain scenarios, so if you can’t detect them using one tool, try using another.
In addition, fromVersion 16.9 of Visual Studio 2019To start, Visual Studio introduces AddressSanitizer, a powerful memory monitoring tool from google (AddressSanitizer was originally only supported on Linux, inherited from gcc), to provide support for compilation options just like gcc:
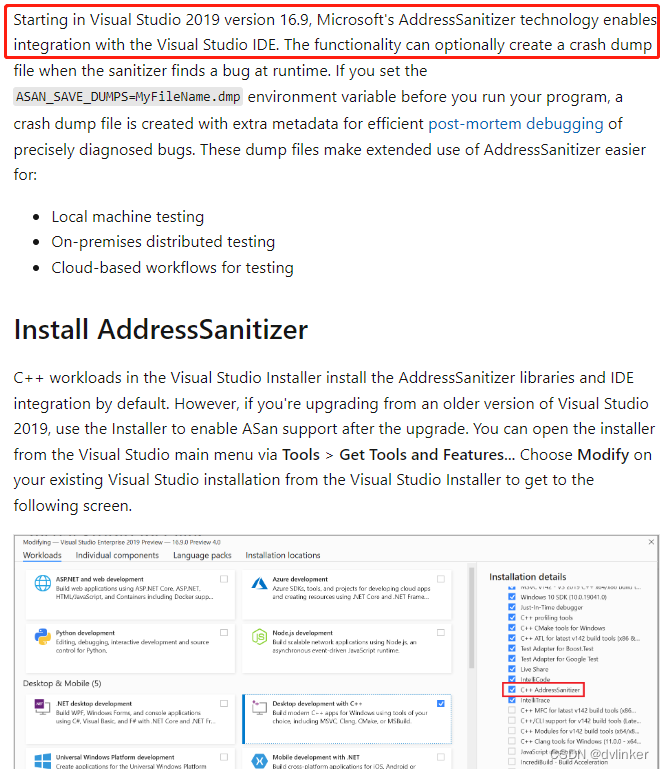
When installing a higher version of Visual Studio, you can set the “C++ AddressSanitizer“The installation option is checked so that AddressSanitizer is supported in Visual Studio.
AddressSanitizer (ASan for short) is a memory error checking tool for C/C++ provided by Google, which can detect Heap buffer overflow, Stack buffer overflow, Global buffer overflow, Use after free, Initialization order bugs, Memory leaks (Use after free) and many other memory problems. It can detect Heap buffer overflow, Stack buffer overflow, Global buffer overflow, Use after free, Initialization order bugs, Memory leaks (Use after free) and many other memory problems.
AddressSanitizer project address:https://github.com/google/sanitizers/wiki/AddressSanitizer
Refer to the documentation page:AddressSanitizerAlgorithm · google/sanitizers Wiki · GitHub
If you want to use AddressSanitizer memory inspection tool, you must use Visual Studio 2019 version 16.9 and above. In addition, AddressSanitizer can not run independently like Windbg, directly attached to the target process to analyze, you need to use AddressSanitizer related compilation options to recompile the code to work.
For detailed instructions on how to use the AddressSanitizer memory analysis tool in Visual Studio, take a look at the official Microsoft article:
3.6.2 Troubleshooting memory leaks on Linux platforms

On the Linux platform, commonly used memory inspection tools are Valgrind and AddressSanitizer, both tools have their advantages.
Valgrind tool can directly monitor the target process, without recompiling the code, it is more convenient to use. However, Valgrind consumes memory when monitoring memory, and at the same time, it will seriously slow down the running speed of the program, which is a big problem for servers that need real-time response.
AddressSanitizer is a memory detection tool produced by google, gcc4.8 and above only built-in AddressSanitizer, through the compilation options to use the tool (need to recompile the code), the tool will take up less memory, will not significantly slow down the program’s running speed. However, to use this tool, you need to have gcc 4.8 and above.
For more information on the advantages of AddressSanitizer and how to use it, check out my previous article:
4. Final
The above explains in detail the GDI object leaks, process handle resource leaks and memory leaks three major categories of problems, I hope to provide you with some reference and reference.
