Elasticsearch is an open source, Lucene-based distributed search and analytics engine designed for use in cloud computing environments that enables real-time, scalable search, analysis, and exploration of full-text and structured data. It is highly scalable and can search and analyze large amounts of data in a short period of time.
More than just a full-text search engine, Elasticsearch provides distributed multi-user capabilities, real-time analytics, and the ability to process complex search statements, making it useful in a wide range of scenarios, such as enterprise search, logging, and event data analysis.
This article describes the introduction, installation and simple use of Kibana, an Elastic Stack component.
Article Catalog
1, Kibana introduction and installation
1.1 Introduction to Kibana
Kibana is an open source data analysis and visualization platform that is part of the Elastic Stack (which includes Elasticsearch, Logstash, Kibana, and Beats) and is primarily used for searching, viewing, and interacting with data in Elasticsearch.
Kibana’s main features and uses include:
-
Data Visualization: Kibana provides rich data visualization options such as bar charts, line charts, pie charts, maps, etc. to help users understand data graphically.
-
Data Exploration: Kibana provides powerful data exploration capabilities, allowing users to query data using Elasticsearch’s query language, as well as filter and sort data through Kibana’s interface.
-
Dashboards: Users can combine multiple visualization components to create interactive dashboards for real-time data monitoring.
-
Machine Learning: Kibana also integrates with Elasticsearch’s machine learning capabilities, which can be used for tasks such as anomaly detection and prediction.
-
Customization and Extension: Kibana provides a rich API and plug-in system that allows users to customize and extend Kibana according to their needs.
Overall, Kibana is a powerful data analysis and visualization tool that helps users better understand and explore their data.
1.2. Download and install
A link to Elastic’s official download page. On this page, you can download various components of the Elastic Stack, including Elasticsearch, Kibana, Logstash, Beats, and more. This page provides links to download the latest version of each component, as well as links to download historical versions:Past Releases of Elastic Stack Software | Elastic
Here, we will select Kibana and make sure that the selected version of Kibana matches the version of Elasticsearch we are using:

Select “Download” to start the download, and unzip it to the specified location after successful download.
1.3 On Configuration
Kibana’s configuration file is usuallykibana.ymlThe following is an example of a Kibana installation directory that is located in theconfig folder. This configuration file is in YAML format and is used to define Kibana’s runtime parameters.
...
# =================== System: Kibana Server (Optional) ===================
# Kibana is served by a back end server. This setting specifies the port to use.
server.port: 5601

# Specifies the address to which the Kibana server will bind. IP addresses and host names are both valid values.
# The default is 'localhost', which usually means remote machines will not be able to connect.
# To allow connections from remote users, set this parameter to a non-loopback address.
server.host: "localhost"

# =================== System: Elasticsearch ===================
# The URLs of the Elasticsearch instances to use for all your queries.
elasticsearch.hosts: ["http://localhost:9200"]

# If your Elasticsearch is protected with basic authentication, these settings provide
# the username and password that the Kibana server uses to perform maintenance on the Kibana
# index at startup. Your Kibana users still need to authenticate with Elasticsearch, which
# is proxied through the Kibana server.
elasticsearch.username: "kibana_system"
elasticsearch.password: "pass"
...
The following are some common Kibana configuration items:
- server.port: port on which the Kibana service listens, default is 5601.
- server.host: The host address of the Kibana service. By default, it is set to the local host. If you want the Kibana service to be accessible from a remote host, you can set this to the IP address of the remote host.
- server.name: The name of the Kibana service. By default, it is set to
your-hostname。 - elasticsearch.hosts: the address where Kibana connects to the Elasticsearch service. By default, it is set to connect to Elasticsearch on the local host on port
9200namelylocalhost:9200。 - elasticsearch.username and elasticsearch.password: The username and password to use when connecting to the Elasticsearch service. By default, Elasticsearch does not have a username and password. However, if you have installed the X-pack plugin in Elasticsearch and set a password, you need to fill in the correct username and password here.
Here, if we have Elasticsearch locally, we can just start it without any configuration modifications
Set the page Chinese:
# Supported languages are the following: English (default) "en", Chinese "zh-CN", Japanese "ja-JP", French "fr-FR".
i18n.locale: "zh-CN"
1.4. Initiating visits
The startup file is located in the/bin/Kibana directory. After starting Kibana, it may take a few moments for Kibana to complete the startup process. Once it has finished booting, you can access it by going to thehttp://localhost:5601 to use Kibana now.

2. Kibana data visualization
2.1 Demonstration data preparation
In order to make Kibana’s graphs look better, we need to prepare some indexes with diversified data. Below is a simple example where we will create an index with sales data with fields like date, product category, sales etc.
First, we need to create an index named “sales” in Elasticsearch and add some data. Below is an example of adding data using Elasticsearch’s REST API:
# Create indexes
curl -X PUT "localhost:9200/sales"

# Add sales data
curl -X POST "localhost:9200/sales/_doc" -H 'Content-Type: application/json' -d'
{
  "date": "2020-01-04",
  "category": "Groceries",
  "revenue": 2000
}
'
curl -X POST "localhost:9200/sales/_doc" -H 'Content-Type: application/json' -d'
{
  "date": "2020-01-05",
  "category": "Electronics",
  "revenue": 3000
}
'
curl -X POST "localhost:9200/sales/_doc" -H 'Content-Type: application/json' -d'
{
  "date": "2020-01-06",
  "category": "Books",
  "revenue": 2500
}
'
curl -X POST "localhost:9200/sales/_doc" -H 'Content-Type: application/json' -d'
{
  "date": "2020-01-07",
  "category": "Clothing",
  "revenue": 1200
}
'
curl -X POST "localhost:9200/sales/_doc" -H 'Content-Type: application/json' -d'
{
  "date": "2020-01-08",
  "category": "Groceries",
  "revenue": 1800
}
'
# ... Add more data ...
2.2. Data visualization configuration
In Kibana, we can use the “Visualize” feature to create various data visualizations. Following are the basic steps to create bar charts, line charts, pie charts etc:
- Open Kibana: Type Kibana’s address into your browser to open the main Kibana interface;
- Go to the Visualize page: In the left navigation bar, click on the “Visualize Library” icon to go to the Visualize page;
- Create Data View: Click on the “Create Data View” button and select the type of visualization you want to create, such as Bar Chart, Line Chart, Pie Chart and so on:
- Select data source: in the new page, select the data source you want to visualize. You can select an already existing index schema or create a new one:

- Save View: Click on “Save Data View to Kibana” to save successfully;
- Configure the visualization: Depending on the type of visualization you choose, configure the corresponding parameters. For example, for a bar chart, you need to select the fields for the X- and Y-axis; for a line chart, you need to select the time field and the metrics field; and for a pie chart, you need to select the fields for the split slices.
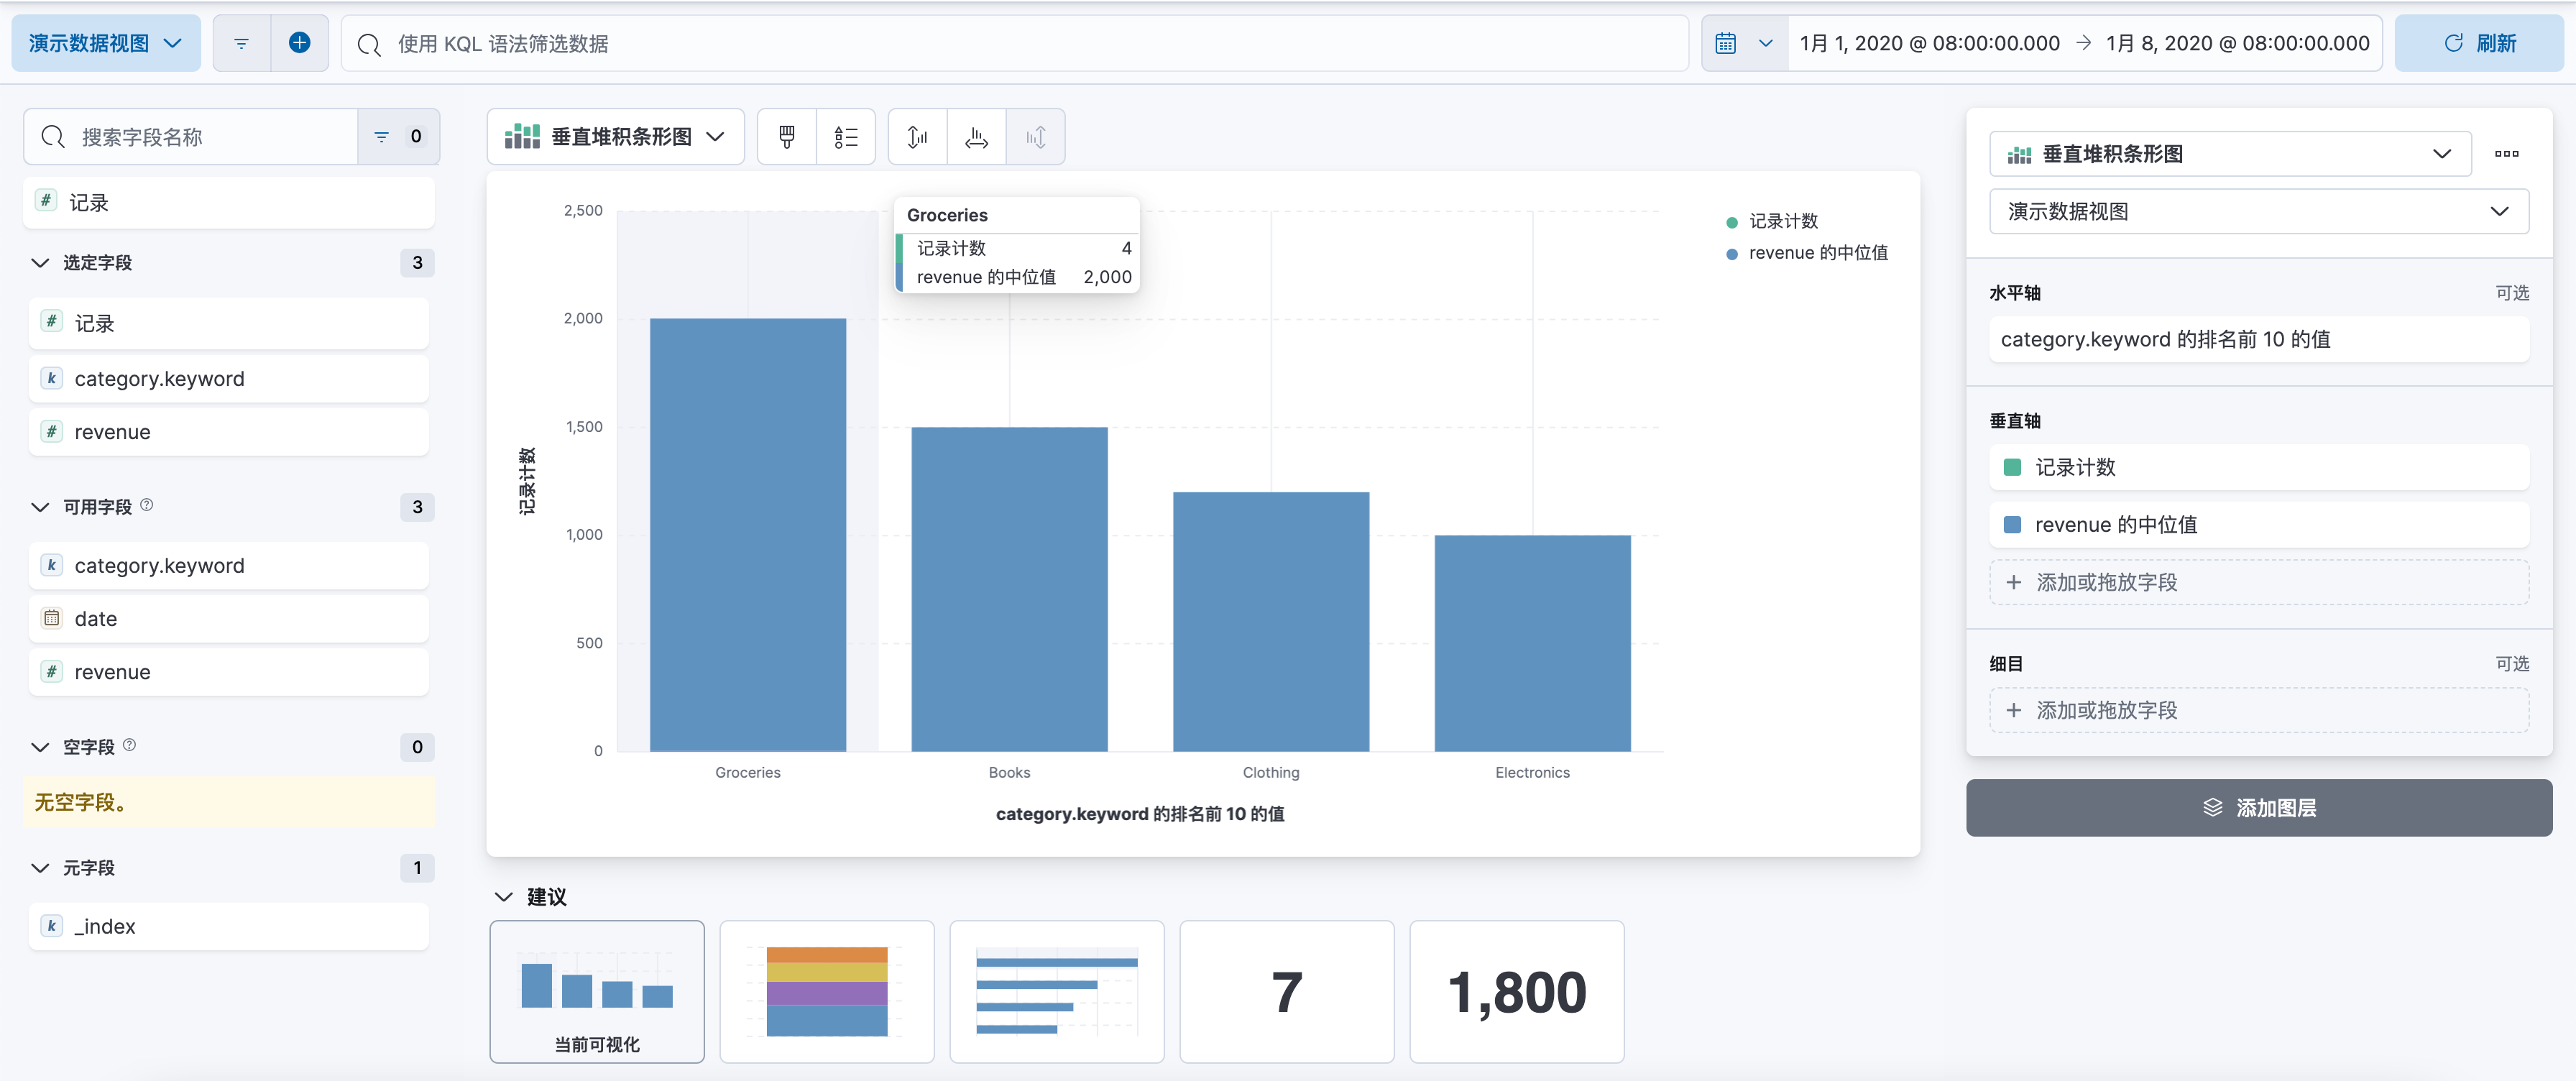
2.3, Placement column chart
Click on the “New Visualization” button and select the “Vertical Bar Chart” option to create a bar chart.
In the “Bucket” section, you need to select the fields for the X-axis and Y-axis. For the X-axis, you can select a categorized field; for the Y-axis, you can select a numeric field and choose an aggregation function such as “Count”, “Mean”, “Total ” etc.

Once the configuration is complete, you can preview your bar chart. If you are satisfied, click the “Save” button to name and save your bar chart.
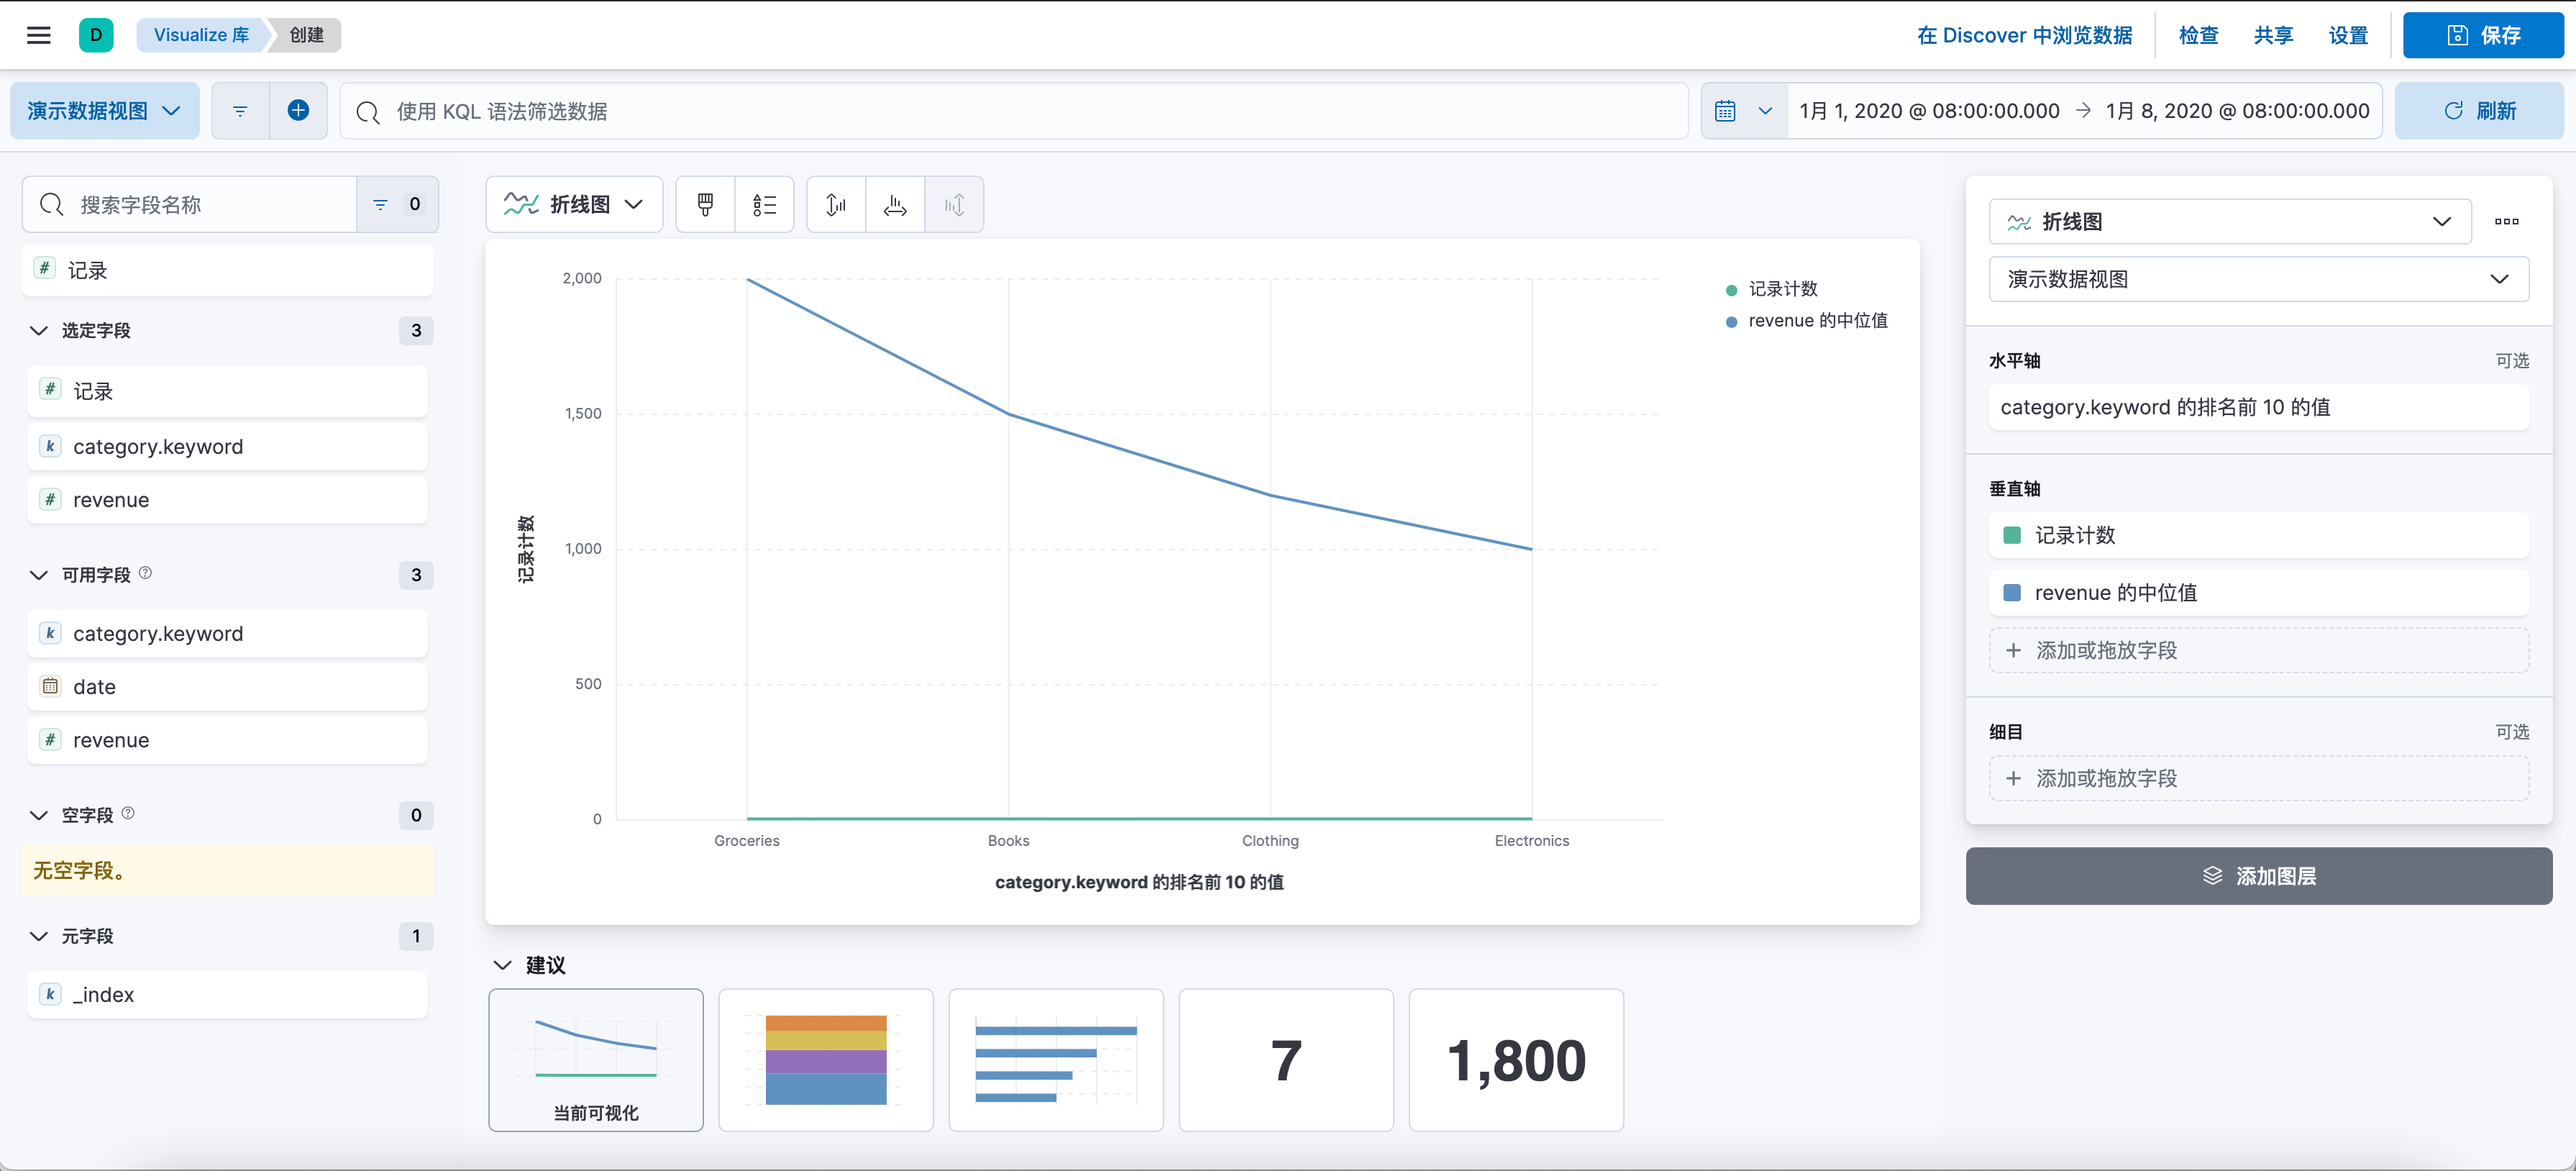
2.4. Configuration line diagram
Click on the “New Visualization” button and select the “Line Chart” option to create a line chart.
In the “Bucket” section, you need to select the fields for the X-axis and Y-axis. For the X-axis, you would normally select a time field; for the Y-axis, you can select a numeric field and choose an aggregation function such as “Count”, “Average”, “Sum ” etc.

Once the configuration is complete, you can preview your wiremap. If you are satisfied, click the “Save” button to name and save your line graph.
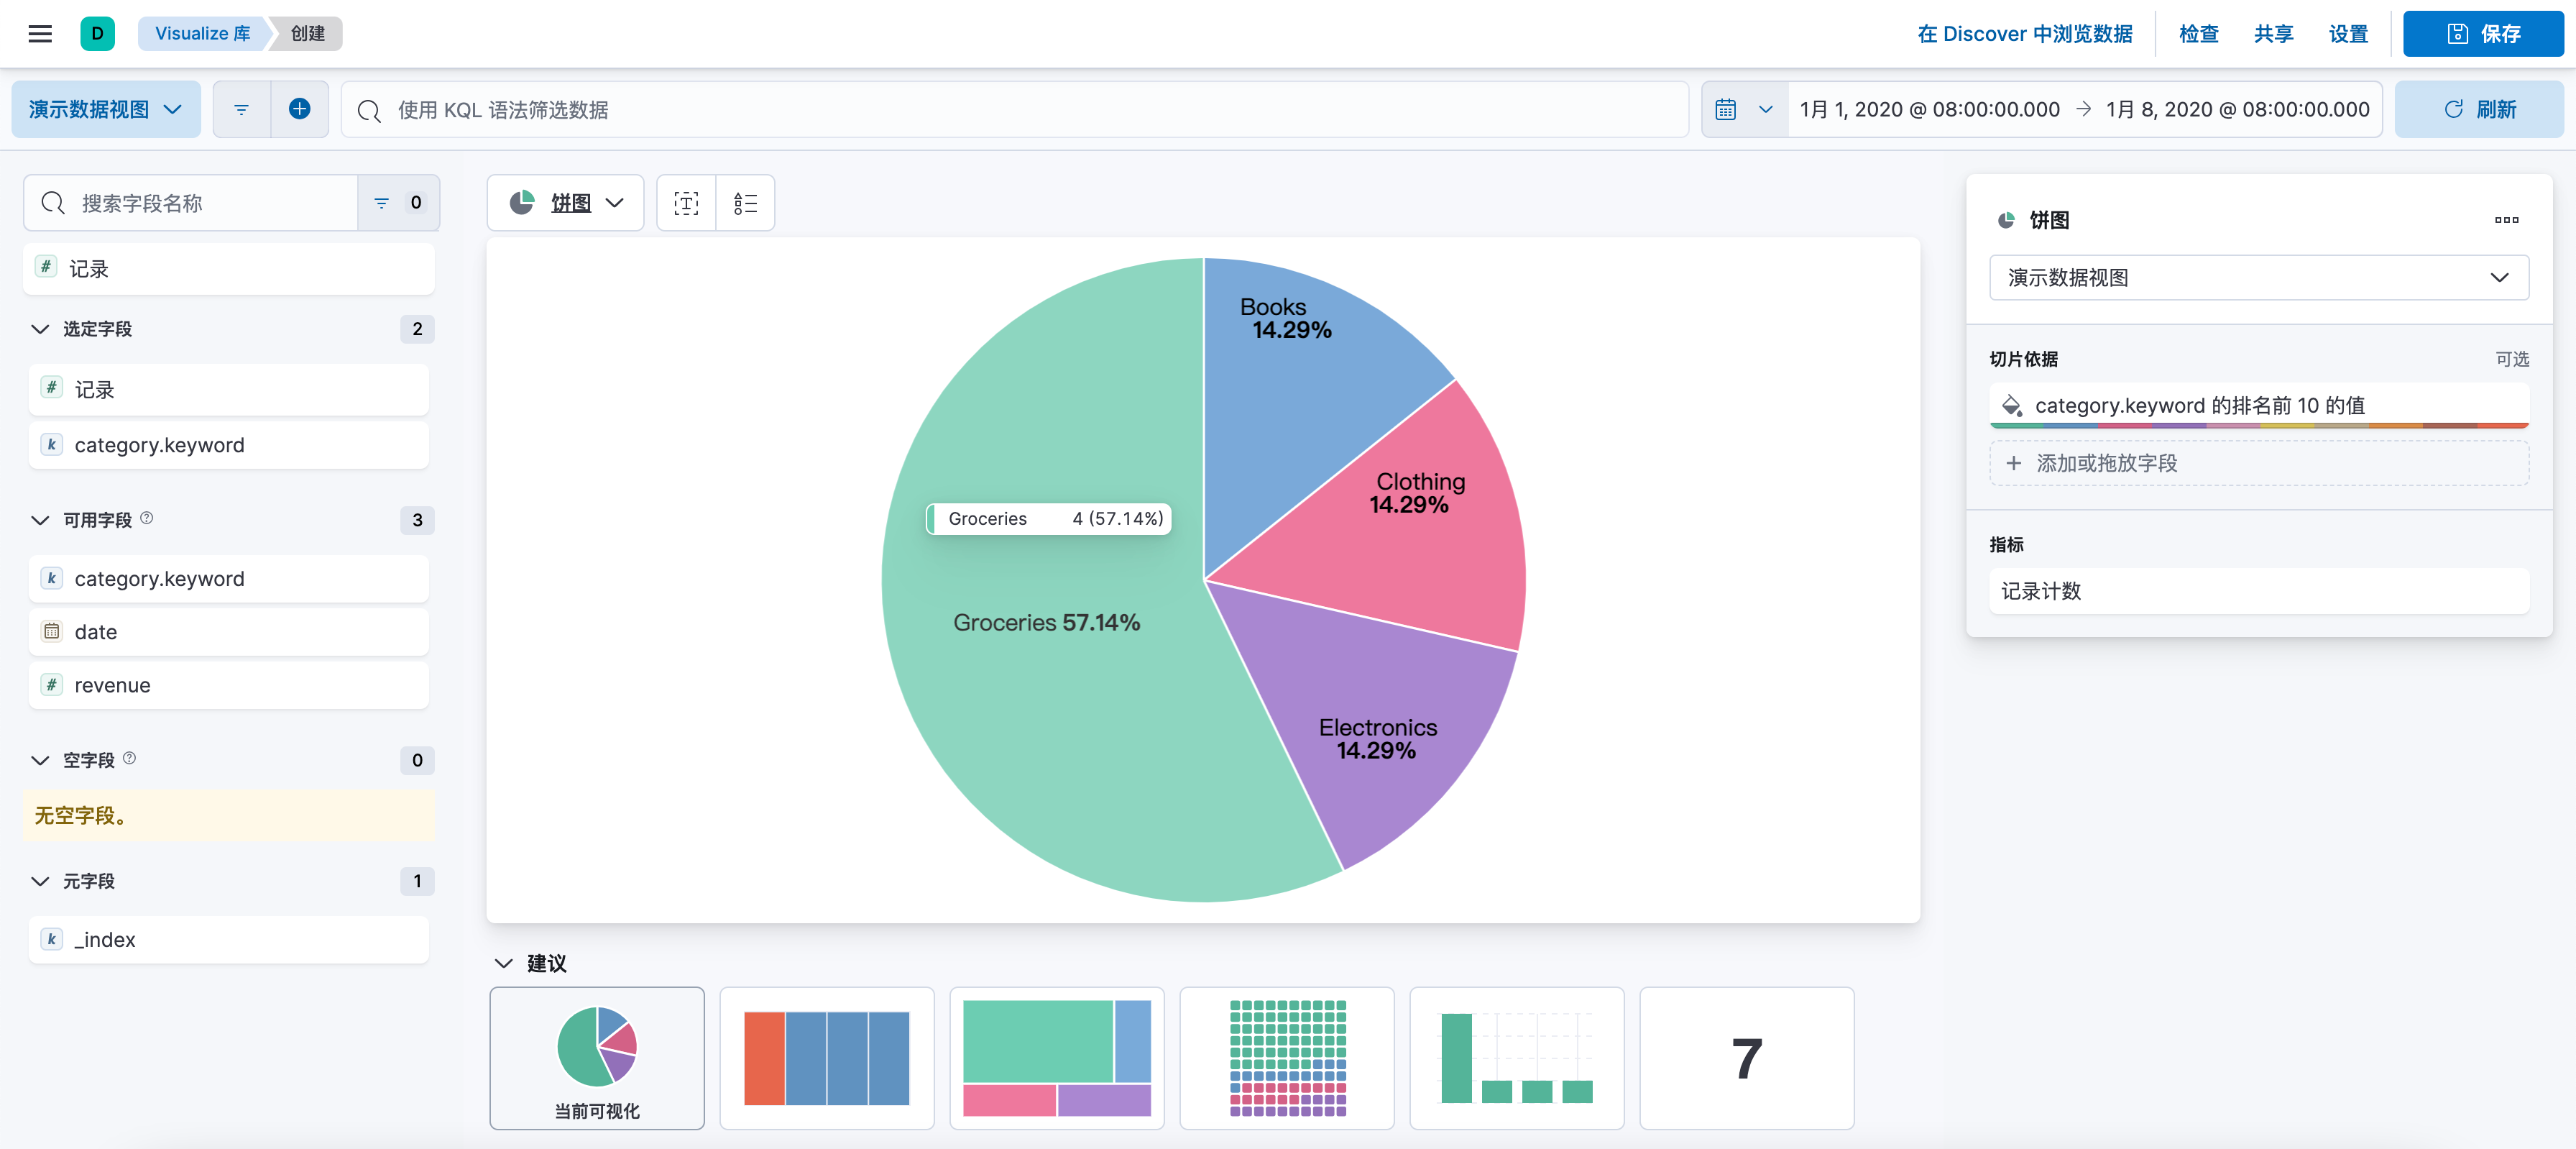
2.5. Configuring pie charts
Click on the “New Visualization” button and select the “Pie Chart” option to create a pie chart graph.
In the “Bucket” section, you need to select one or more fields to split the pie chart. You can select a categorized field and choose an aggregation function such as “Count”, “Mean”, “Sum”, etc.

Once the configuration is complete, you can preview your pie chart. If you are satisfied, click the ‘Save’ button to name and save your pie chart.
3、More functions of Kibana
3.1 Data exploration
Kibana provides powerful data exploration features that allow users to query data using Elasticsearch’s query language, as well as filter and sort data through Kibana’s interface. Here are the basic steps for using these features:
-
Open Kibana: Type Kibana’s address into your browser to open the main Kibana interface.
-
Go to the Discover page: In the left navigation bar, click the “Discover” icon to go to the Discover page.
-
Selecting an Indexing Schema: At the top of the Discover page, you can select an indexing schema; Kibana displays the data corresponding to that indexing schema.
-
Perform a data query: In the Query field, you can enter a query statement for Elasticsearch and press Enter to execute the query. The query results will be displayed in the table below.
-
Perform data filtering: At the top of the table, you can see all the field names. By clicking on a field name, you can add a filter to show only the data that satisfies that condition.
-
Sorting data: In the header of the table, you can click on the column name of any column to sort the column in ascending or descending order.
These are the basic steps for data exploration in Kibana. Note that different data sources may require different query statements and filter conditions, and you need to proceed accordingly.
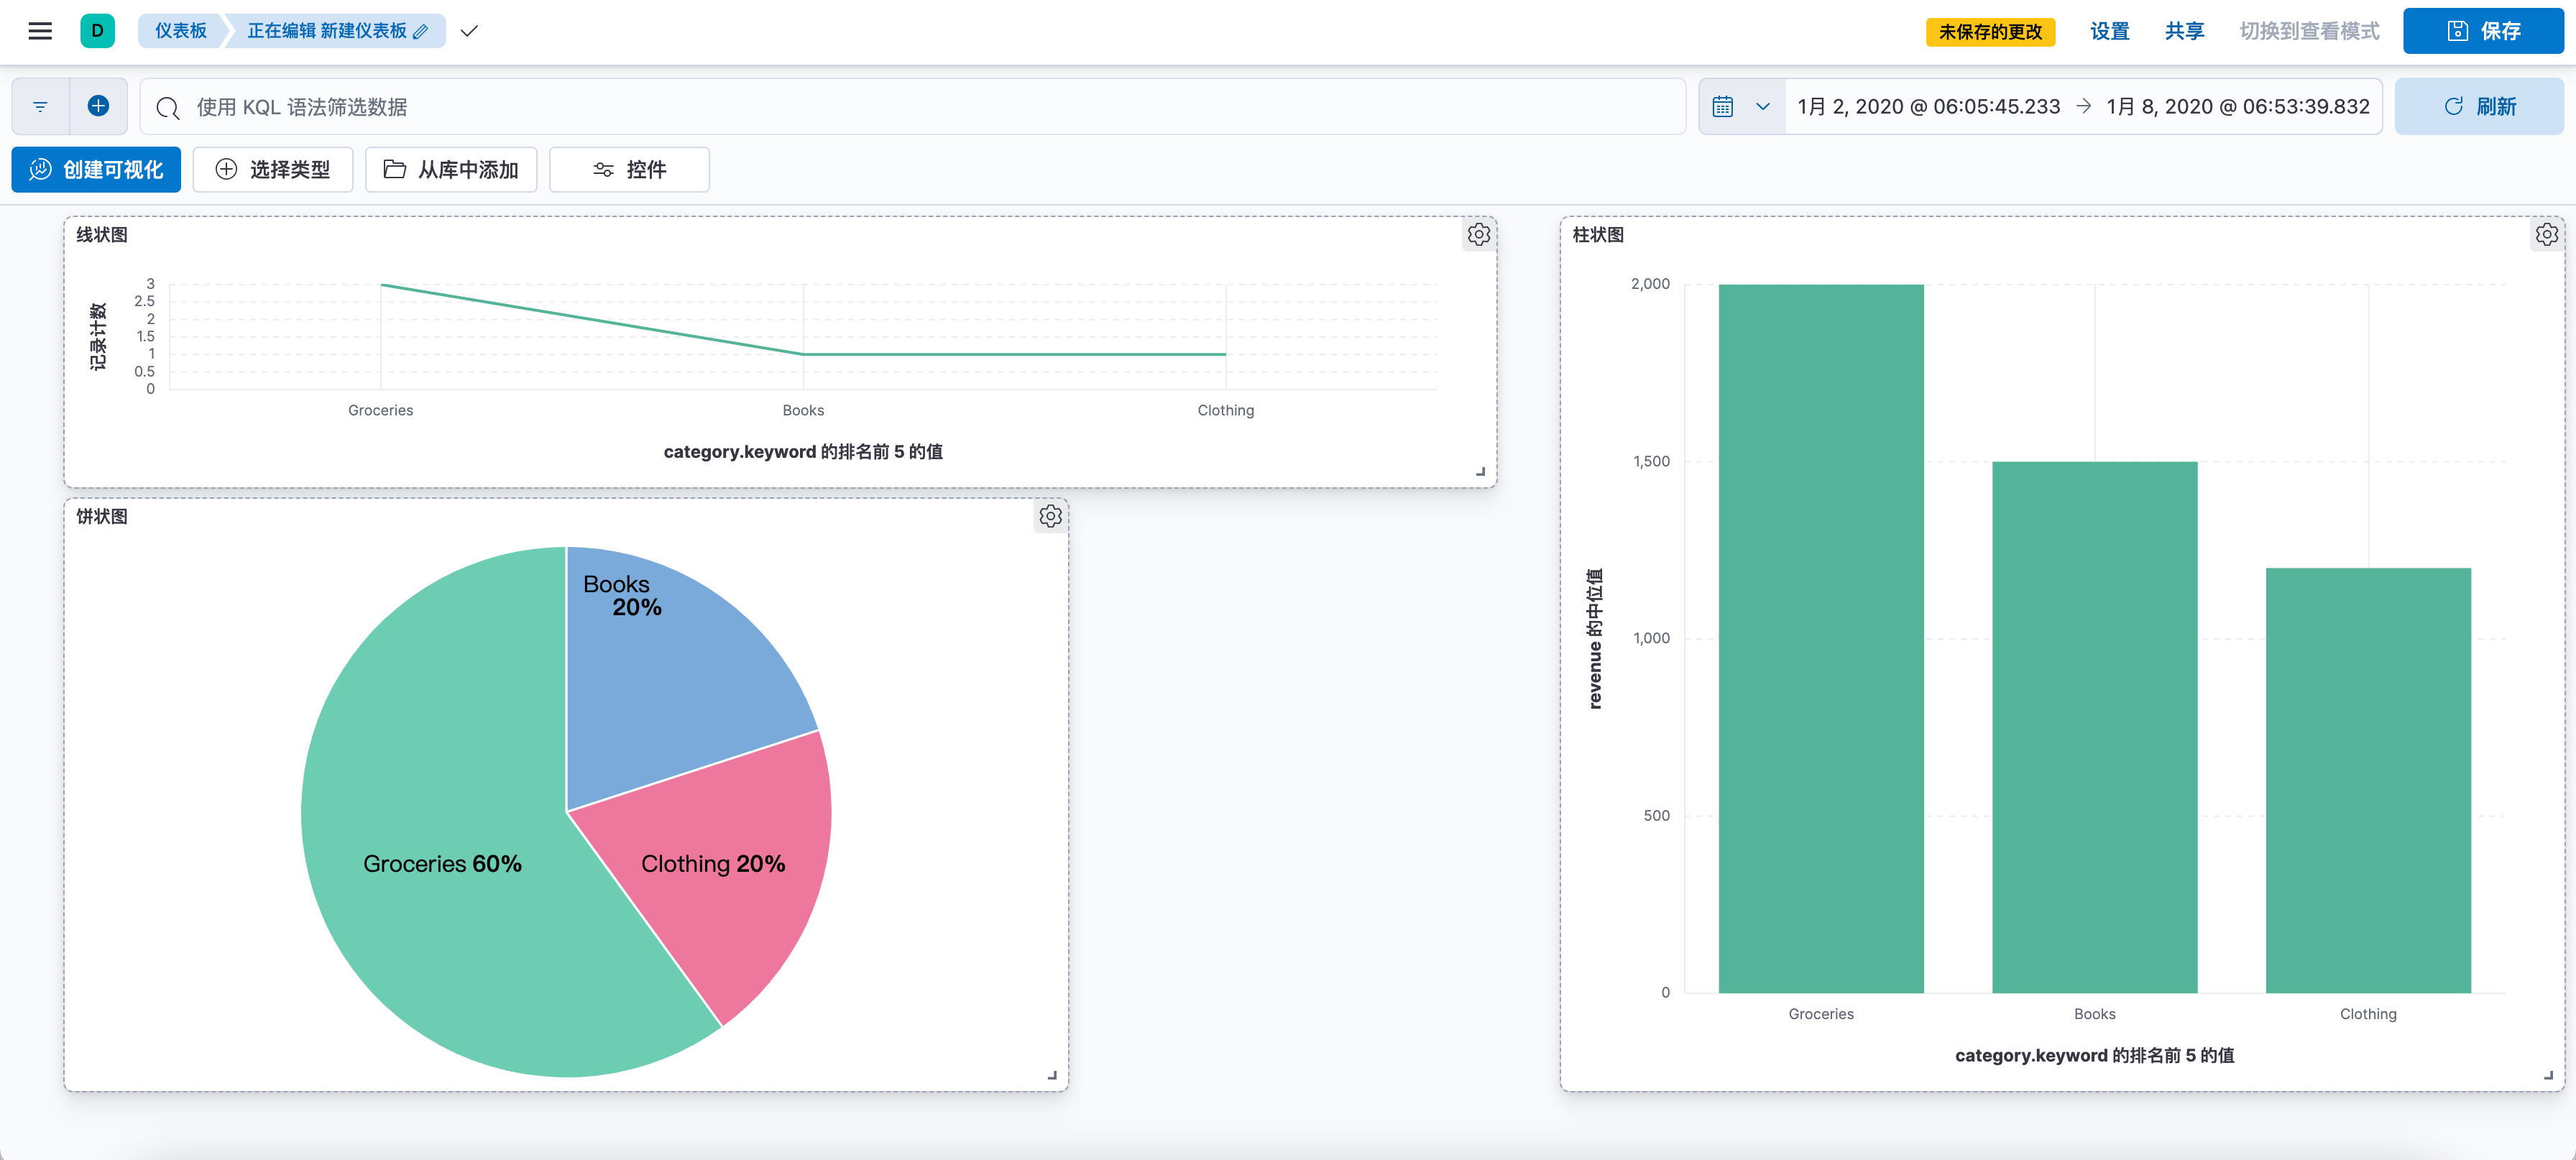
3.2. Dashboards
In Kibana, you can use the “Dashboards” feature to combine multiple visualizations into a unified interface. Here are the basic steps to configure a dashboard:
-
Open Kibana: Type Kibana’s address into your browser to open the main Kibana interface.
-
To access the Dashboard page: In the left navigation bar, click on the “Dashboard” icon to access the Dashboard page.
-
Create a new dashboard: Click the “Create Dashboard” button to start creating a new dashboard.
-
Add Visualization: In the new dashboard page, click the “Add” button and you can see a list of all the visualizations that have been created. Select the visualization you want to add to the dashboard and click the “Add” button.
-
Adjusting the layout: after adding visualizations, you can adjust their position and size in the dashboard by dragging and zooming.

- Save Dashboard: After adjusting the layout, click the “Save” button to name and save your dashboard.
These are the basic steps to configure a dashboard in Kibana. It is important to note that dashboards can only contain visualizations that have already been created, so you need to create all the visualizations you need before creating a dashboard.
