Large amounts of data can be searched and analyzed in a short period of time.
More than just a full-text search engine, Elasticsearch provides distributed multi-user capabilities, real-time analytics, and the ability to process complex search statements, making it useful in a wide range of scenarios, such as enterprise search, logging, and event data analysis.
In this article, we will introduce the implementation of ELK+Kafka+Beats for log collection platform.
Article Catalog
1. About ELK and BKELK
1.1, ELK architecture and its implications
When we talk about open source log analytics, the ELK architecture is a household name. However, this ecosystem was not intended by Elastic – after all, Elasticsearch was originally intended as a distributed search engine. Its widespread use in logging systems was unexpected and driven by the community of users. Nowadays, many cloud service vendors often use ELK as a reference point when promoting their logging services, which shows how far-reaching ELK’s influence is.
ELK is an acronym for Elasticsearch, Logstash, and Kibana, all three of which are open-source projects from Elastic and are often used together to search, analyze, and visualize data.
-
Elasticsearch: a Lucene-based search server. It provides a distributed , multi-tenant full-text search engine with HTTP web interface and schema-free JSON documents.
-
Logstash: is a server-side data processing pipeline that receives data from multiple sources simultaneously, transforms it, and then sends it to the place of your choice.
-
Kibana: is an open source data visualization plugin for Elasticsearch. It provides a way to find , view and interact with the data stored in the Elasticsearch index . You can use it for advanced data analysis and visualize your data and so on.
These three tools are often used together to collect, search, analyze and visualize data from a variety of sources.
1.2. Log analysis system implementation based on BKLEK architecture
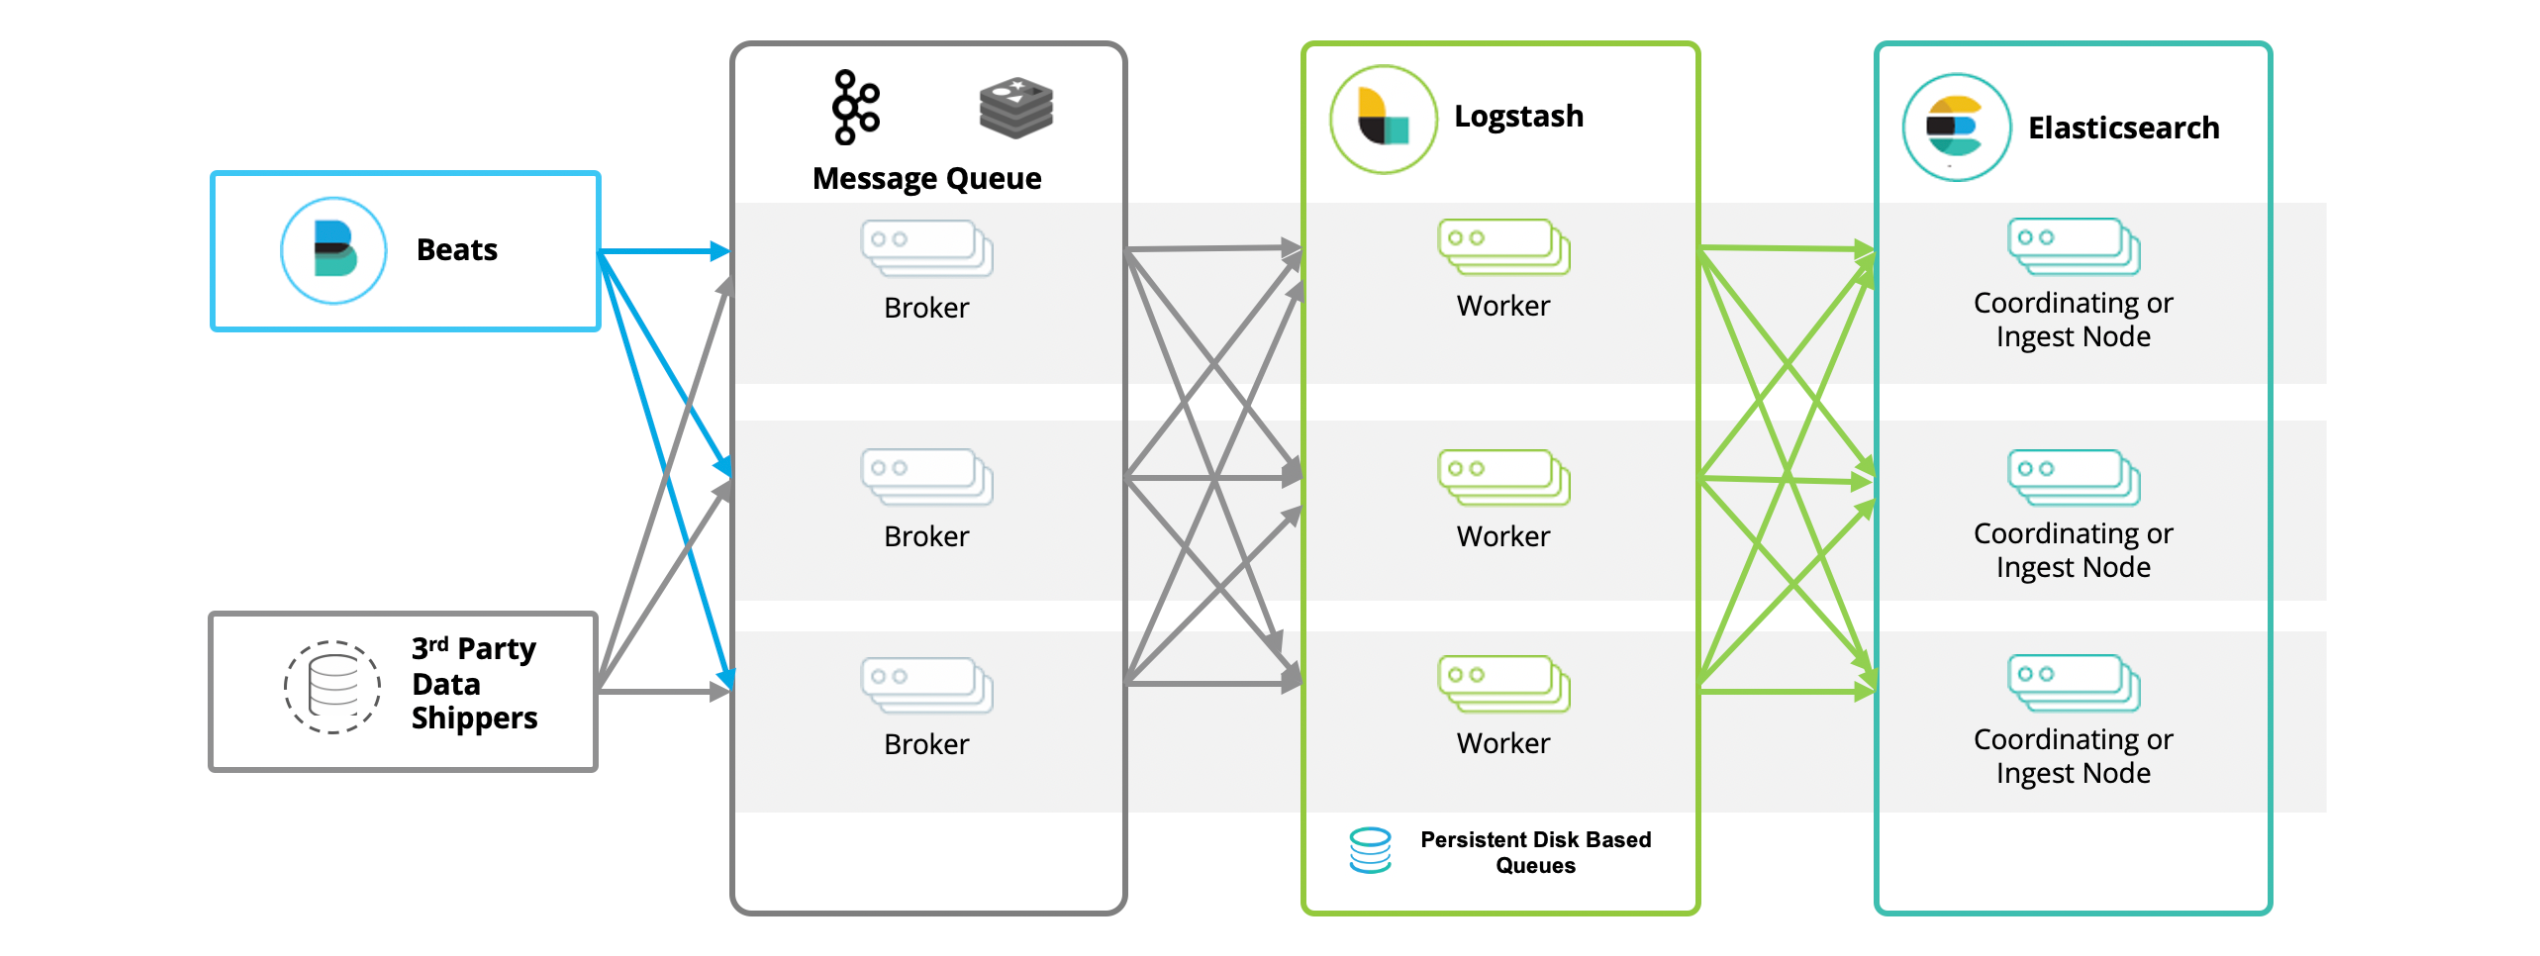
In fact, ELKB is not the only popular architecture. when we build a logging system with ELKB, there is another widely used tool besides Elasticsearch, Logstash, Kibana, and beats – Kafka. in this system, the role of In this system, the role of Kafka is particularly important. As a middleware and buffer, it can improve throughput, isolate the impact of peaks, cache log data, and quickly drop the disk. At the same time, through the producer/consumer mode, so that Logstash can be horizontally scalable, can also be used for data distribution. So, for the most part, the actual architecture we see, in order of data flow, would be the BKLEK architecture.

BKLEK architecture i.e. ELK+Kafka+Beats , which is a common architecture for big data processing and analytics. In this architecture:
-
Beats: is a lightweight data collector used to collect data from a variety of sources (e.g., syslogs, network traffic, etc.) and send the data to Kafka or Logstash.
-
Kafka: is a distributed stream processing platform for processing and storing real-time data. In this architecture, Kafka is mainly used as a buffer that receives data from Beats and transfers it to Logstash.
-
Logstash: A powerful log management tool that takes data from Kafka, filters and transforms it, and then sends it to Elasticsearch.
-
Elasticsearch: is a distributed search and analytics engine for storing, searching and analyzing large amounts of data.
-
Kibana: is a data visualization tool for searching and viewing stored data in Elasticsearch.
The advantages of this architecture are:
- Can handle large amounts of real-time data.
- Kafka provides a powerful buffer that can handle high speed inflow of data and ensure data integrity.
- Logstash provides powerful data processing capabilities that can perform a variety of complex filters and transformations on data.
- Elasticsearch provides powerful data search and analysis capabilities.
- Kibana provides an intuitive interface for data visualization.
This architecture is typically used in scenarios such as log analysis, real-time data processing and analysis, and system monitoring.
2, the use of ELK + Kafka + Beats to achieve a unified logging platform
2.1 Application Scenarios
ELK+Kafka+Beats is used to implement a unified logging platform, which is an APM tool specialized in unified collection, storage and analysis of large-scale distributed system logs. In a distributed system, many services are deployed on different servers, and a client request may trigger the invocation of multiple services in the back-end, which may call each other or a service may call other services, and finally return the request result and display it on the front-end page. If an anomaly occurs at any point in the process, it may be difficult for developers and operations staff to accurately determine which service call caused the problem. The role of the unified logging platform is to trace the complete invocation link of each request and collect the performance and log data of each service in the link, so that development and operation and maintenance personnel can quickly find and locate the problem.
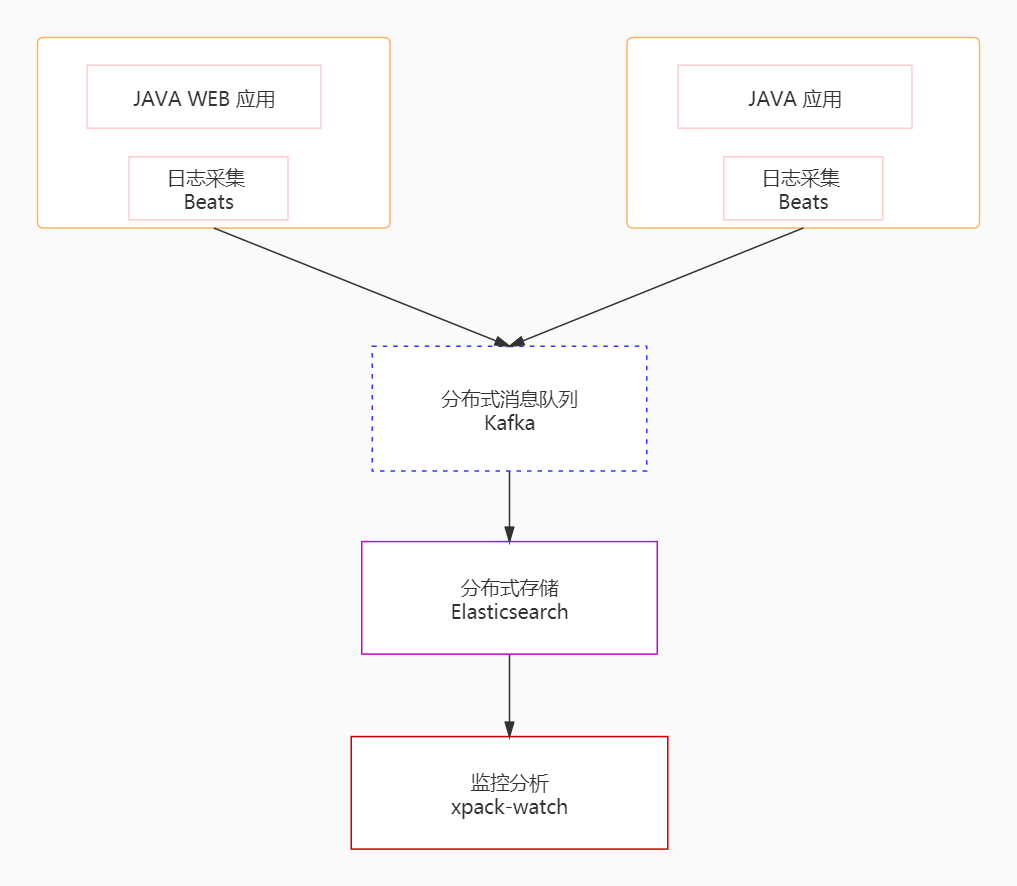
The unified log platform realizes the unified collection, storage and analysis of log data through the collection module, transmission module, storage module and analysis module, and the structure diagram is as follows:

In order to realize the collection and analysis of massive log data, the first thing that needs to be solved is how to deal with a large amount of data information. In this case, we use Kafka, Beats and Logstash to build a distributed message queue platform. Specifically, we use Beats to collect log data, which is equivalent to playing the role of a producer in the Kafka message queue, generating messages and sending them to Kafka, and then these log data are sent to Logstash for analysis and filtering, where Logstash plays the role of a consumer. The processed data is stored in Elasticsearch and finally we use Kibana to visualize the log data.
2.2 Environmental preparation
this locality
- Kafka
- ES
- Kibana
- filebeat
- Java Demo Project
We use Docker to create a network called es-net.
In Docker, networking is the way to connect and isolate Docker containers. When you create a network, we define a network environment of containers that can communicate with each other.
docker network create es-net
docker network create is a command in the Docker command line interface to create a new network. After this command, you need to specify the name of the network you want to create, in this case, the name of the network is “es-net”.
So.docker network create es-net This command means to create a Docker network called “es-net”.
2.3 Docker-based ES deployment
Load Mirror:
docker pull elasticsearch:7.12.1Run the container:
docker run -d \
	--name es \
    -e "ES_JAVA_OPTS=-Xms512m -Xmx512m" \
    -e "discovery.type=single-node" \
    --privileged \
    --network es-net \
    -p 9200:9200 \
    -p 9300:9300 \


elasticsearch:7.12.1
    -v es-data:/Users/lizhengi/elasticsearch/data \
    -v es-plugins:/Users/lizhengi/elasticsearch/plugins \
This command runs an Elasticsearch container named “es” using Docker. The meaning of the specific parameters is as follows:
-
docker run -d: Run a new container with Docker and run it in background mode (detached mode). -
--name es: Set the name of the container to “es”. -
-e "ES_JAVA_OPTS=-Xms512m -Xmx512m": Setting Environment VariablesES_JAVA_OPTSThis is a JVM parameter that controls the minimum and maximum memory used by Elasticsearch. Here, the minimum and maximum memory are both set to 512MB. -
-e "discovery.type=single-node": Setting Environment Variablesdiscovery.type, which is an Elasticsearch parameter that sets the cluster discovery type. Here it is set to single node mode. -
-v es-data:/Users/lizhengi/elasticsearch/datarespond in singing-v es-plugins:/Users/lizhengi/elasticsearch/plugins: mount volume. These two parameters set the host’ses-datarespond in singinges-pluginsdirectory is mounted to the container’s/Users/lizhengi/elasticsearch/datarespond in singing/Users/lizhengi/elasticsearch/pluginsCatalog. -
--privileged: Run the container in privileged mode. This will allow the container to access all devices on the host, and processes in the container can gain any AppArmor or SELinux privileges. -
--network es-net: Connect the container to thees-netNetworking. -
-p 9200:9200respond in singing-p 9300:9300: Port Mapping. These two parameters map ports 9200 and 9300 of the container to ports 9200 and 9300 of the host. -
elasticsearch:7.12.1: The name and label of the Docker image you want to run. Here we are using the Elasticsearch image with version 7.12.1.
Run the result verification: then you can go to access IP:9200, the result is as shown in the figure:

2.4. Docker-based kibana deployment
Load Mirror:
docker pull kibana:7.12.1
Run the container:
docker run -d \
		--name kibana \
		-e ELASTICSEARCH_HOSTS=http://es:9200 \
		--network=es-net \
		-p 5601:5601  \
kibana:7.12.1
This is a Docker command to run a Kibana container. Here is an explanation of each parameter:
-
docker run -d: Run a new container with Docker and run it in background mode (detached mode). -
--name kibana: Set the name of the container to “kibana”. -
-e ELASTICSEARCH_HOSTS=http://es:9200: Setting Environment VariablesELASTICSEARCH_HOSTSThis is a Kibana parameter that specifies the address of the Elasticsearch service. Here it is set tohttp://es:9200This means that Kibana will connect to port 9200 of a container named “es” in the same Docker network. -
--network=es-net: Connect the container to thees-netNetworking. -
-p 5601:5601: Port Mapping. This parameter maps port 5601 of the container to port 5601 of the host. -
kibana:7.12.1: The name and label of the Docker image you want to run. Here we are using a Kibana image with version 7.12.1.
The kibana startup is generally slow and you need to wait a little longer, which can be done with the command:
docker logs -f kibanaCheck the run log, when the following log is viewed, it indicates success:

Run the result verification: then you can go to access IP:9200, the result is as shown in the figure:
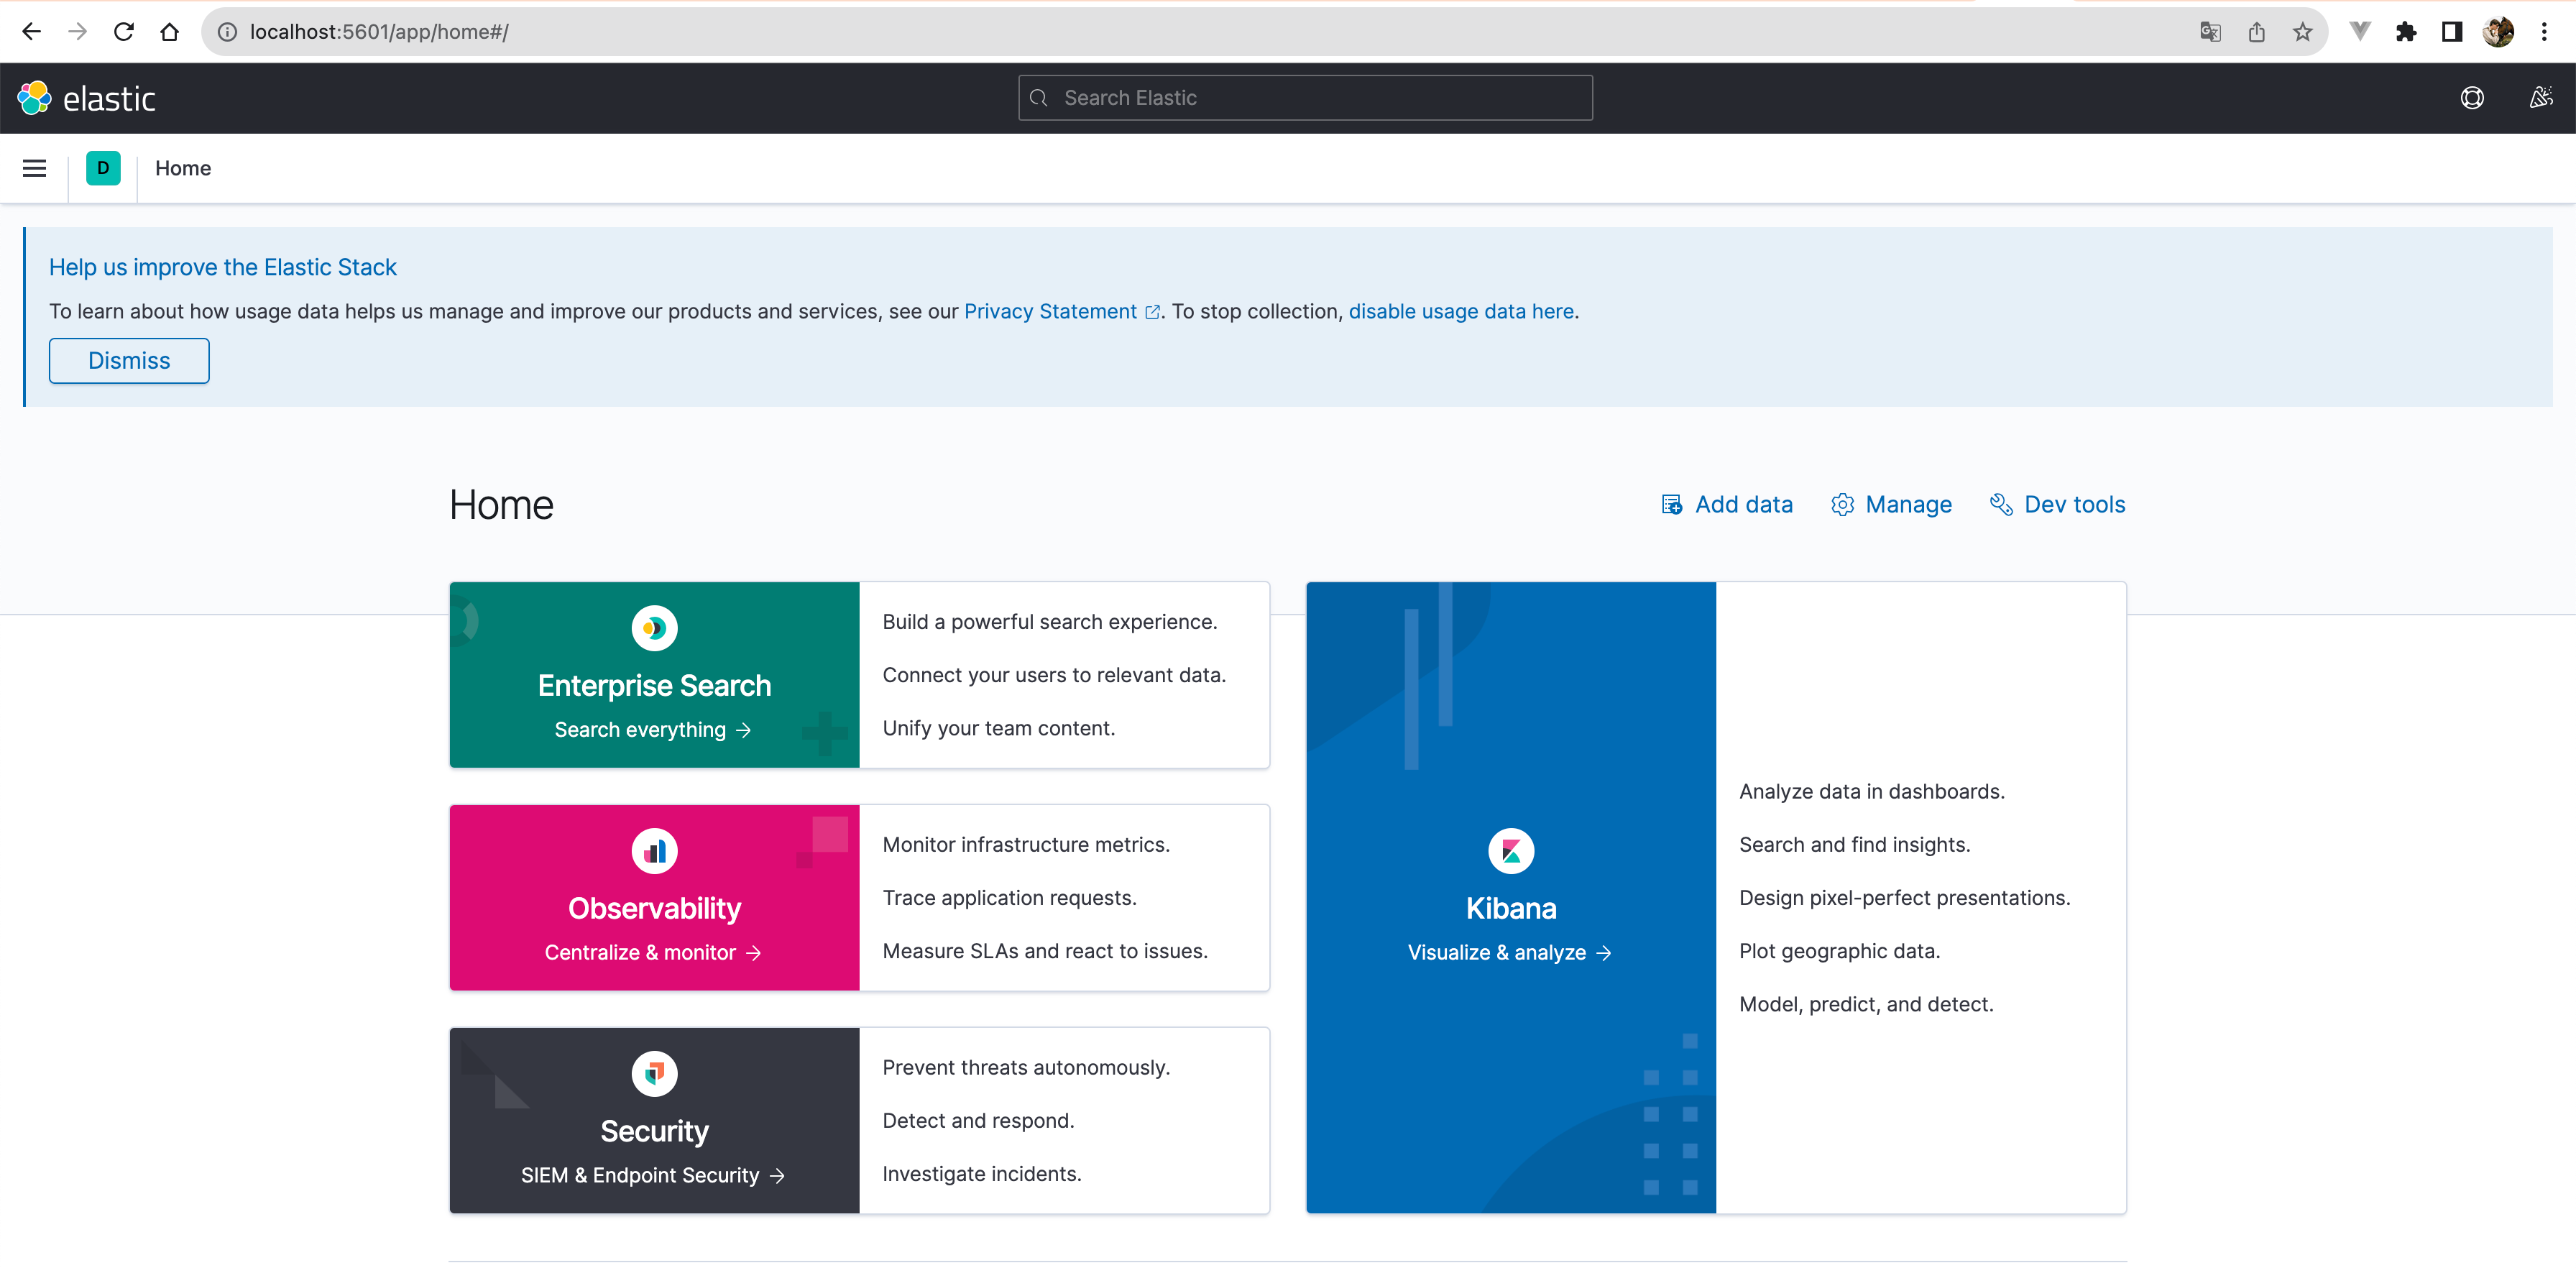
Browser access is also available:

2.5. Docker-based Zookeeper deployment
Load Mirror:
docker pull zookeeper:latest
Run the container:
The following is a basic Docker command to run a Zookeeper container:
docker run -d \
    --name zookeeper \
    --network=es-net \
    -p 2181:2181 \
zookeeper:latest
The parameters of this command are explained below:
docker run -d: Run a new container with Docker and run it in background mode (detached mode).--name zookeeper: Set the name of the container to “zookeeper”.--network=es-net: Connect the container to thees-netNetworking.-p 2181:2181: Port Mapping. This parameter maps port 2181 of the container to port 2181 of the host.zookeeper:latest: The name and label of the Docker image you want to run. The latest version of the Zookeeper image is used here.
2.6. Docker-based Kafka deployment
Load Mirror:
docker pull confluentinc/cp-kafka:latest
Run the container:
Here is a basic Docker command to run a Kafka container:
docker run -d \
    --name kafka \
    --network=es-net \
    -p 9092:9092 \
    -e KAFKA_ZOOKEEPER_CONNECT=zookeeper:2181 \
    -e KAFKA_ADVERTISED_LISTENERS=PLAINTEXT://kafka:9092 \
confluentinc/cp-kafka:latest
The parameters of this command are explained below:
docker run -d: Run a new container with Docker and run it in background mode (detached mode).--name kafka: Set the name of the container to “kafka”.--network=es-net: Connect the container to thees-netNetworking.-p 9092:9092: Port Mapping. This parameter maps port 9092 of the container to port 9092 of the host.-e KAFKA_ZOOKEEPER_CONNECT=zookeeper:2181: Setting Environment VariablesKAFKA_ZOOKEEPER_CONNECTThis is a Kafka parameter that specifies the address of the Zookeeper service. Here it is set tozookeeper:2181This means that Kafka will connect to port 2181 of a container named “zookeeper” on the same Docker network.-e KAFKA_ADVERTISED_LISTENERS=PLAINTEXT://localhost:9092: Setting Environment VariablesKAFKA_ADVERTISED_LISTENERSThis is a Kafka parameter that specifies the address and port that the Kafka service publishes to the public. The settings here arePLAINTEXT://localhost:9092。confluentinc/cp-kafka:latest: The name and label of the Docker image you want to run. Here we are using the latest version of the Kafka image for the Confluent platform.
2.7 Docker-based Logstash deployment
Load Mirror:
docker pull docker.elastic.co/logstash/logstash:7.12.1
Create a configuration file:
First, you need to create a Logstash configuration file, for examplelogstash.confThe content is as follows:
input {
  kafka {
    bootstrap_servers => "kafka:9092"
    topics => ["logs_topic"]
  }
}

output {
  elasticsearch {
    hosts => ["es:9200"]
    index => "logs_index"
  }
}
This configuration file defines the inputs and outputs of Logstash. The input is Kafka, which connects tokafka:9092The subject of the subscription isyour_topic. The output is Elasticsearch ates:9200The index name islogs_index。
Run the container:
We then run the Logstash container using the following command:
docker run -d \
    --name logstash \
    --network=es-net \
    -v /Users/lizhengi/test/logstash.conf:/usr/share/logstash/pipeline/logstash.conf \
docker.elastic.co/logstash/logstash:7.12.1
The parameters of this command are explained below:
docker run -d: Run a new container with Docker and run it in background mode (detached mode).--name logstash: Set the name of the container to “logstash”.--network=es-net: Connect the container to thees-netNetworking.-v /path/to/your/logstash.conf:/usr/share/logstash/pipeline/logstash.conf: Mount volume. This parameter sets the host’slogstash.conffile is mounted to the container’s/usr/share/logstash/pipeline/logstash.conf。docker.elastic.co/logstash/logstash:latest: The name and label of the Docker image you want to run. The latest version of the Logstash image is used here.
Note that you need to set the/path/to/your/logstash.conf Replace yourlogstash.conf The actual path where the file is located.
2.8. Docker-based Filebeat deployment
Load Mirror:
docker pull docker.elastic.co/beats/filebeat:7.12.1
Run the container:
First, you need to create a Filebeat configuration file, for examplefilebeat.ymlThe content is as follows:
filebeat.inputs:
- type: log
  enabled: true
  paths:
    - /usr/share/filebeat/logs/*.log

output.kafka:
  enabled: true
  hosts: ["kafka:9092"]
  topic: "logs_topic"
This configuration file defines the inputs and outputs of Filebeat. The input is the file/usr/share/filebeat/Javalog.logThe output is Kafka, which is connected to thekafka:9092The theme islogs_topic。
You can then run the Filebeat container using the following command:
docker run -d \
    --name filebeat \
    --network=es-net \
    -v /Users/lizhengi/test/logs:/usr/share/filebeat/logs \
    -v /Users/lizhengi/test/filebeat.yml:/usr/share/filebeat/filebeat.yml \
docker.elastic.co/beats/filebeat:7.12.1
The parameters of this command are explained below:
-
docker run -d: Run a new container with Docker and run it in background mode (detached mode). -
--name filebeat: Set the name of the container to “filebeat”. -
--network=es-net: Connect the container to thees-netNetworking. -
-v /Users/lizhengi/test/Javalog.log:/usr/share/filebeat/Javalog.log: Mount volume. This parameter sets the host’s/Users/lizhengi/test/Javalog.logfile is mounted to the container’s/usr/share/filebeat/Javalog.log。 -
-v /path/to/your/filebeat.yml:/usr/share/filebeat/filebeat.yml: Mount volume. This parameter sets the host’sfilebeat.ymlfile is mounted to the container’s/usr/share/filebeat/filebeat.yml。 -
docker.elastic.co/beats/filebeat:latest: The name and label of the Docker image you want to run. The latest version of the Filebeat image is used here.
Note that you need to set the/path/to/your/filebeat.yml Replace yourfilebeat.yml The actual path where the file is located.
