Article Catalog
1, Kmeans principle
K-means algorithm is a commonly used
clustering algorithm for dividing a data set into k non-overlapping clusters. The main idea is to divide the sample points into different clusters by iterating, so that the sample points within the same cluster are more similar and the similarity between different clusters is less.
Below we explain the principle of the KMeans algorithm in a simple case where the aim is to cluster sample points into 3 categories (K=3)
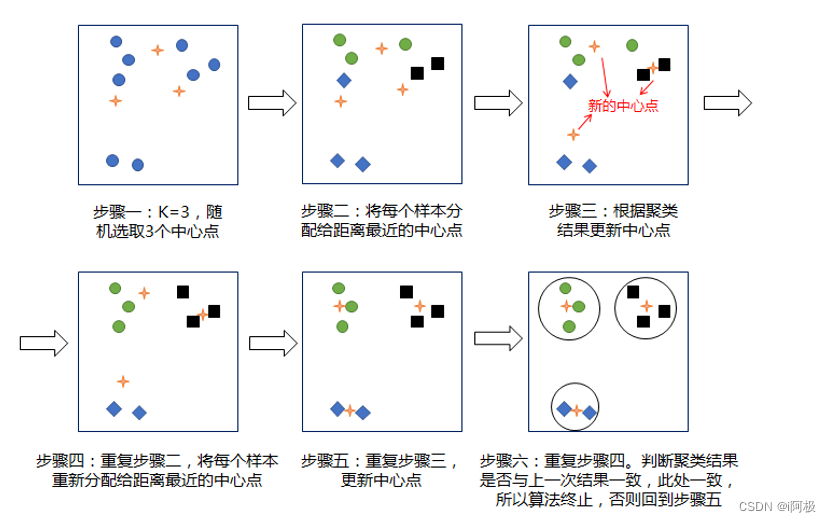 Here are the detailed steps of the K-means algorithm:
- Initialization: k initial cluster centers are selected, either randomly or according to some heuristic. The clustering centers are usually k sample points selected from the dataset.
- Assigning sample points: for each sample point, calculate its distance (e.g., Euclidean distance) from each cluster center, and assign the sample point to the cluster where the closest cluster center is located.
- Update Cluster Center: for each cluster, calculate the mean of all its sample points and use that mean as the new cluster center.
- Repeat steps 2 and 3 until the clustering center no longer changes or a predetermined number of iterations is reached.
- Output: k clusters are finally obtained, each containing a set of sample points.
Characterization of the K-means algorithm:
- The K-means algorithm is an iterative algorithm that optimizes the clustering results through multiple iterations.
- The K-means algorithm is based on a distance metric for sample point assignment and clustering center update.
- The K-means algorithm is sensitive to outliers, which may affect the clustering results.
- The K-means algorithm requires that the number k of clusters be specified in advance.
Optimization methods for the K-means algorithm:
- The number of iterations of the algorithm is controlled by increasing the number of iterations or setting a convergence condition.
- Using a better initialization method, such as the K-means++ algorithm, allows for better selection of the initial clustering centers.
- For outliers, distance-based outlier detection methods can be used or density-based clustering algorithms can be employed.
2. Experimental environment
Python 3.9
Jupyter Notebook
Anaconda
3、Kmeans simple code implementation
3.1 Constructed data
import numpy as np
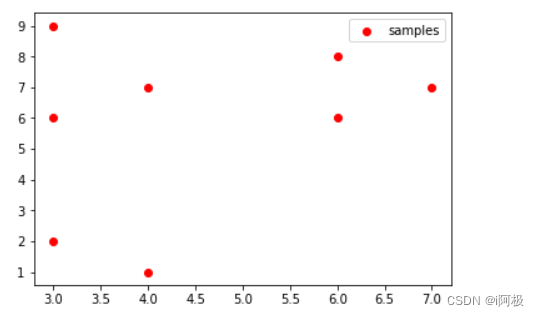
data = np.array([[3, 2], [4, 1], [3, 6], [4, 7], [3, 9], [6, 8], [6, 6], [7, 7]])
3.2 Visualization
import matplotlib.pyplot as plt
plt.scatter(data[:, 0], data[:, 1], c="red", marker='o', label='samples') # Plot scatterplot in red circle style with labels
plt.legend() # set the legend, the content of the legend is the label parameter set above
plt.show()
3.3 Clustering into binary classification
from sklearn.cluster import KMeans
kms = KMeans(n_clusters=2)
kms.fit(data)

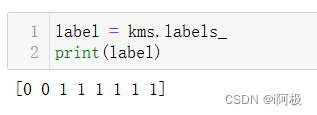
3.4 Obtaining results
label = kms.labels_
print(label)
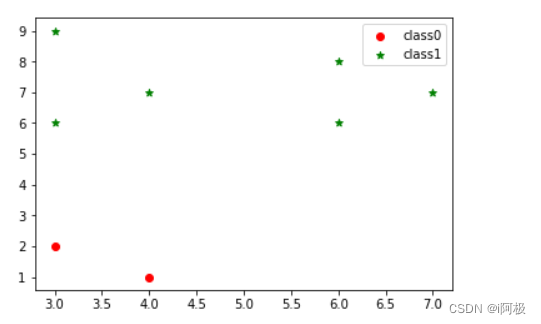
3.5 Visualization of results
plt.scatter(data[label == 0][:, 0], data[label == 0][:, 1], c="red", marker='o', label='class0') # Plot scatter plot in red circle style with labels
plt.scatter(data[label == 1][:, 0], data[label == 1][:, 1], c="green", marker='*', label='class1') # Plot scatter plot in green star style with labels
plt.legend() # set the legend
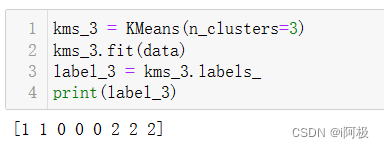
3.6 Clustering into 3 classes
kms_3 = KMeans(n_clusters=3)
kms_3.fit(data)
label_3 = kms_3.labels_
print(label_3)
3.7 Visualization of results
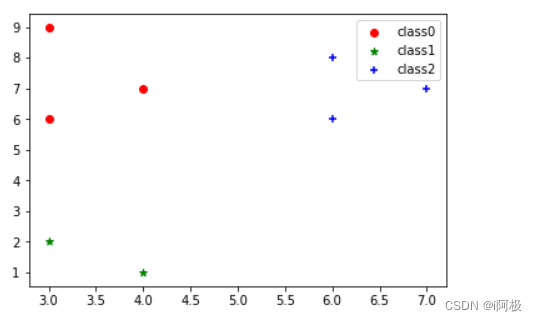
plt.scatter(data[label_3 == 0][:, 0], data[label_3 == 0][:, 1], c="red", marker='o', label='class0') # Plot scatter plot in red circle style with labels
plt.scatter(data[label_3 == 1][:, 0], data[label_3 == 1][:, 1], c="green", marker='*', label='class1') # Plot scatter plot in green star style with labels
plt.scatter(data[label_3 == 2][:, 0], data[label_3 == 2][:, 1], c="blue", marker='+', label='class2') # Plot scatter plot in blue plus style with labels
plt.legend() # set the legend
4、Kmeans case practice
4.1 Case background
Banks usually have a large number of customers, for different customers, the bank needs to carry out different marketing and work strategies, for example, for high-income and risk-tolerant customers, you can focus on tapping business opportunities, for example, you can give him to promote some of the high yield but relatively long cycle of financial products; and for low-income and risk-tolerant customers, you need to develop different marketing and work strategies. strategies. Therefore, for banks, it is usually necessary to categorize their customers into different groups and deal with them differently.
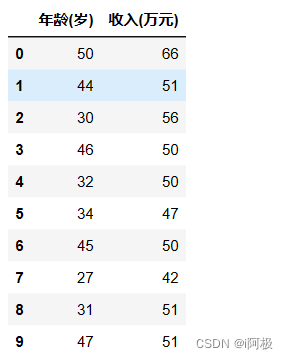
4.2 Reading data
import pandas as pd
data = pd.read_excel('Customer Information.xlsx')
data.head(10)
4.2 Visualization
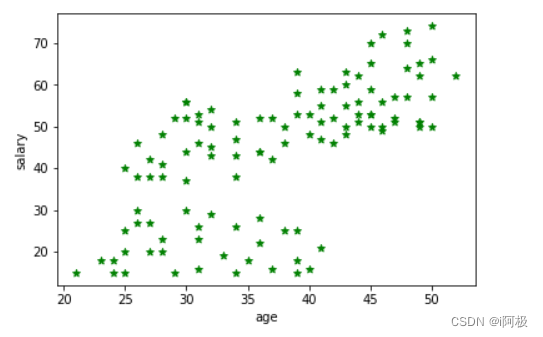
import matplotlib.pyplot as plt
plt.scatter(data.iloc[:, 0], data.iloc[:, 1], c="green", marker='*') # Plot scatter plot in green star style
plt.xlabel('age') # add x-axis name
plt.ylabel('salary') # add y-axis name
plt.show()
4.3 Data modeling
from sklearn.cluster import KMeans
kms = KMeans(n_clusters=3, random_state=123)
kms.fit(data)
label = kms.labels_
label = kms.fit_predict(data)
print(label)

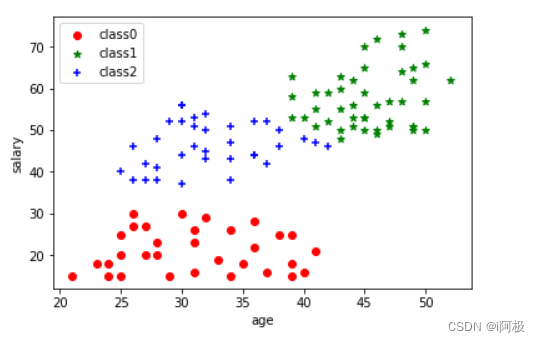
4.4 Visualization of modeling effects
plt.scatter(data[label == 0].iloc[:, 0], data[label == 0].iloc[:, 1], c="red", marker='o', label='class0') # Plot the scatter plot in red circle style with label
plt.scatter(data[label == 1].iloc[:, 0], data[label == 1].iloc[:, 1], c="green", marker='*', label='class1') # Plot scatter plot in green star style with labels
plt.scatter(data[label == 2].iloc[:, 0], data[label == 2].iloc[:, 1], c="blue", marker='+', label='class2') # Plot the scatter plot in blue plus style with labels
plt.xlabel('age') # add x-axis name
plt.ylabel('salary') # add y-axis name
plt.legend() # set the legend
 Here are the detailed steps of the K-means algorithm:


