1. Reading of pictures (below left)
I=imread('Cute Cat.jpg');%image read, here '' within the 'path\name', such as: 'E:\examples\cute cat.jpg'
figure,imshow(I);%image display
title('Original image') 
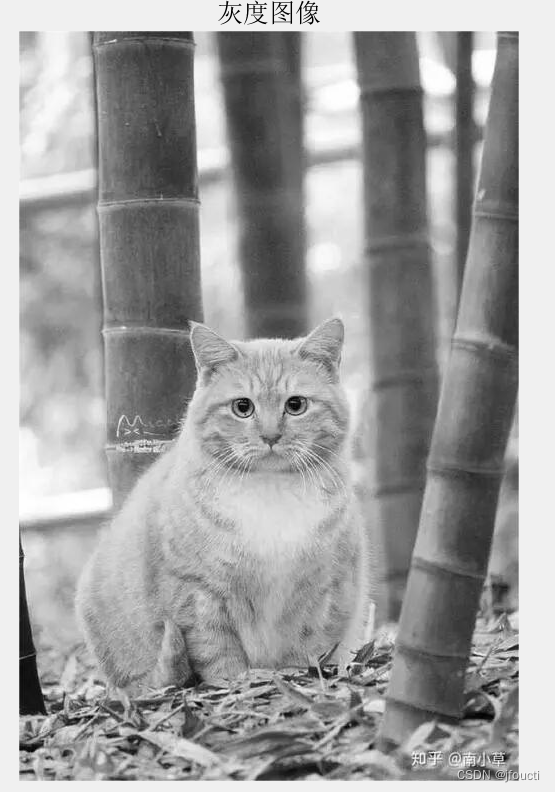
2. Convert to grayscale image (top right)
I_gray=rgb2gray(I);
figure,imshow(I_gray);
title('Grayscale image')
One way to see if it is a grayscale image:
disp(‘Output string’) % Outputs the string;
ndims()% output matrix dimension, here grayscale image or binary image matrix dimension are 2, color image is 3. So can not tell whether it is a grayscale image or binary image. Before matlab has function isgray(), now removed, just use the following method will be.
imwrite(I,’I_gray.jpg’)%Save I as a .jpg image named I_gray.
if(ndims(I)==2)
    disp('It's a grayscale map').
    imwrite(I,'I_gray.jpg')
else
    disp('Not a grayscale map')
    Ig=rgb2gray(I);%convert to grayscale Ig
    imwrite(Ig,'I_gray.jpg')
end
3. Linear expansion
a=0.6;
b=1;
c=0.5;
d=0.8;
J=imadjust(I,[a;b],[c;d]);
subplot(1,2,1);%canvas 1 row and 2 columns, put in the first one
imshow(J);
title('Linear Extension').
4. Non-linear expansion
C=1.5;
K=C*log(1+((double(I))/255));%Image Normalization
subplot(1,2,2);%canvas 1 row and 2 columns, put in the second one
imshow(K);
title('Non-Linear Extension').
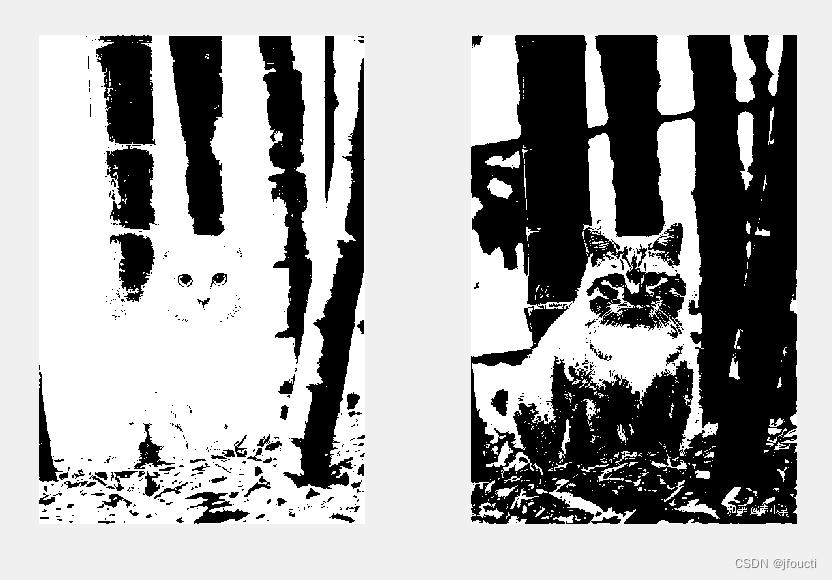
5. Binarization
N1=im2bw(I,0.4);
N2=im2bw(I,0.7);
subplot(1,2,1);
imshow(N1);
subplot(1,2,2);
imshow(N2);
 6. Zoom
a=imresize(I,1.5);%scale to 1.5 times
b=imresize(I,[420,384]);%non-scaled
c=imresize(I,0.7);%scaled to 0.7 times
d=imresize(I,[150,80]);
subplot(2,2,1);
imshow(a);
title('a');
subplot(2,2,2);
imshow(b);
title('b');
subplot(2,2,3);
imshow(c);
title('c');
subplot(2,2,4);
imshow(d);
title('d');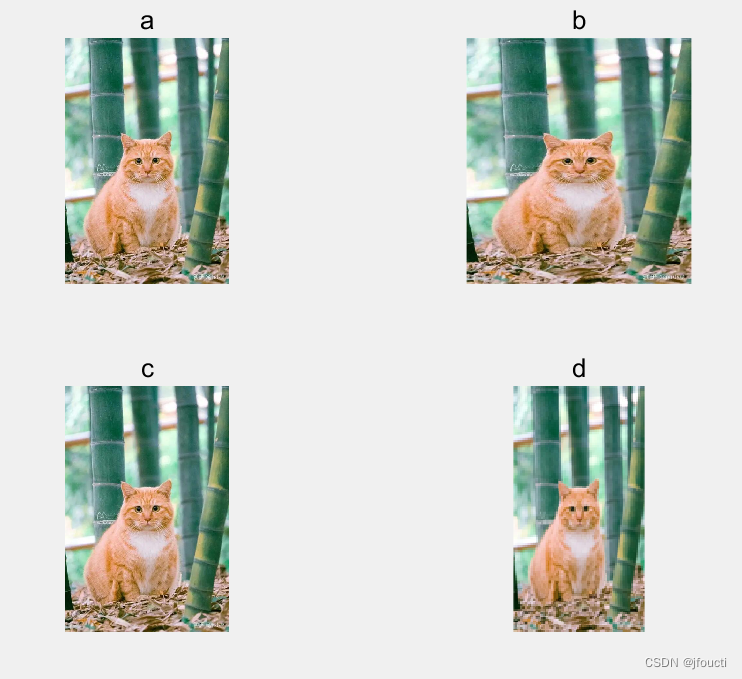
(Oh, pussycat.)
7. Rotation
K=imrotate(I,45);
subplot(1,2,1);
imshow(K);
title('Rotate by 45 degrees');
L=imrotate(I,180);
subplot(1,2,2);
imshow(L);
title('Rotate by 180 degrees');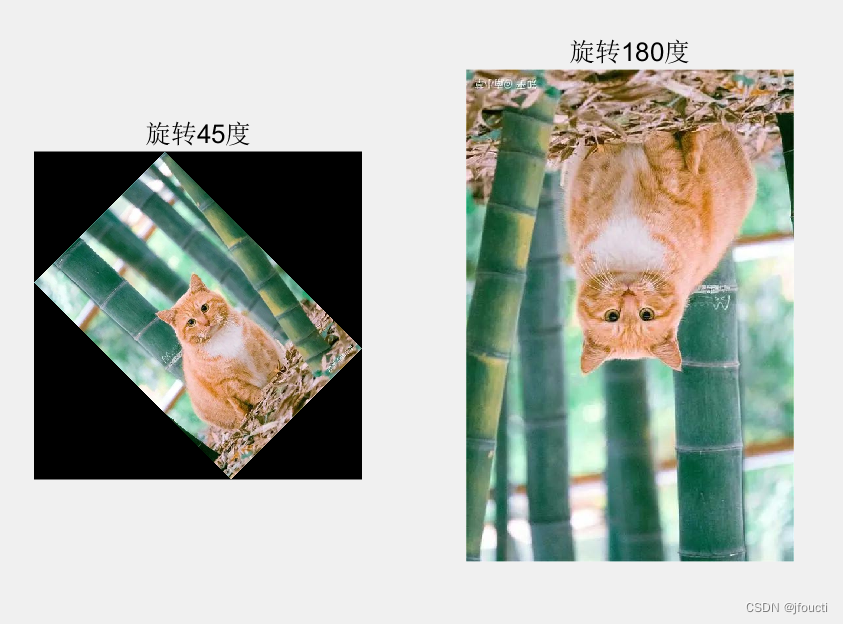
8. Line detection
The code here is to detect horizontal lines, can be replaced according to the annotation template to detect vertical and other directions of the line
I=im2bw(I,0.7);%Here the image should be binarized or converted to grayscale first

w=[-1 -1 -1; 2 2 2; -1 -1 -1]; % Level
% w=[-1 -1 2; -1 2 -1; 2 -1 -1]; % Vertical
% w=[-1 2 -1; -1 2 -1; -1 2 -1]; %45 degree
% w=[2 -1 -1; -1 2 -1; -1 -1 2]; %-45 degrees

g=imfilter(double(I), w);
figure,subplot(2,3,1);
imshow(g,{}) % filtered image
title('Horizontal-Filtering')

g=abs(g);
subplot(2,3,2);
imshow(g,{})
title('g=abs(g)')

T=max(g(:));
g=g>=T;
subplot(2,3,3);
imshow(g)
title('Threshold is T')

T=(1/3)*max(g(:));
g=g>=T;
subplot(2,3,4);
imshow(g)
title('Threshold is 1/3 maximum')

T=(2/3)*max(g(:));
g=g>=T;
subplot(2,3,5);
imshow(g)
title('Threshold is 2/3 maximum')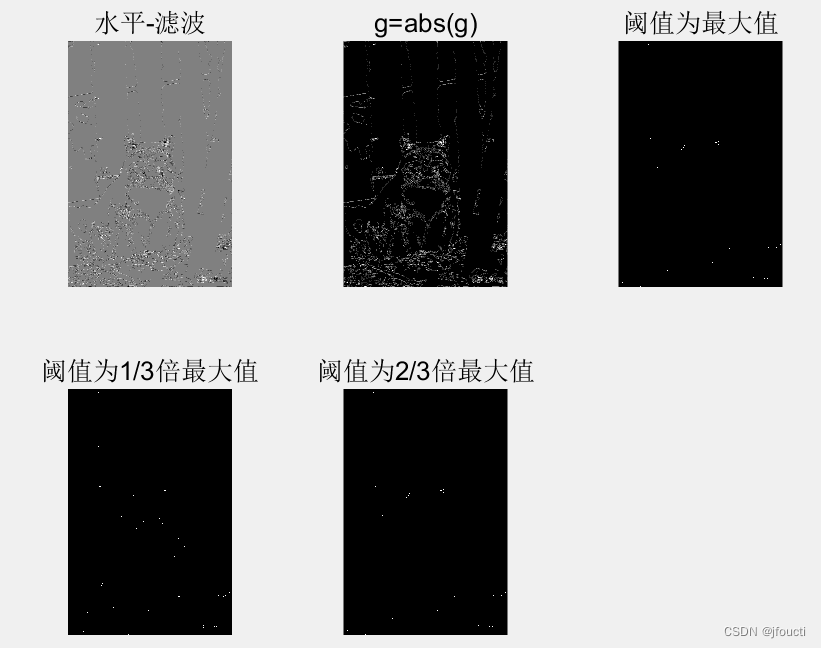
Masking Example:

9. Edge detection
edge() function
E.g. BW = edge(I,’prewitt’,THRESH,DIRECTION) means for image I, use prewitt method;
THRESH: specifies the sensitivity threshold for the Prewitt prewitt method. The edge ignores all edges that are not stronger than THRESH. If you do not specify THRESH, or if THRESH is null, edge automatically selects this value.
DIRECTION: looks for “horizontalhorizontal” or “vertical vertical” edges, or “both” (default).
Test three methods, Canny, Prewitt, and Sobel.
I_gray=rgb2gray(I);%Here the image should be binarized or converted to grayscale first
a=edge(I_gray,'Canny');
b= edge(I_gray,'Prewitt');
c=edge(I_gray,'Sobel');
subplot(1,3,1);
imshow(a);
title('Canny');
subplot(1,3,2);
imshow(b);
title('Prewitt');
subplot(1,3,3);
imshow(c);
title('Sobel');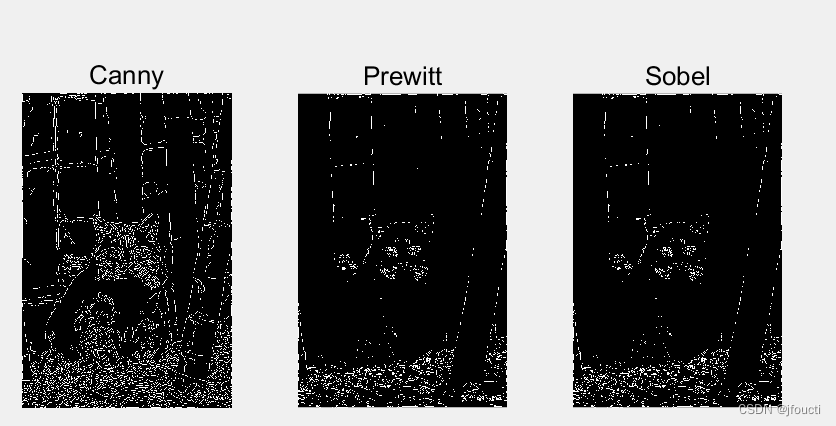 Testing different directions and different thresholds.
A=edge(I_gray,'Prewitt',0.02,'horizontal');
B=edge(I_gray,'Prewitt',0.15,'horizontal');
C=edge(I_gray,'Prewitt',0.02,'vertical');
D=edge(I_gray,'Prewitt',0.1,'vertical');
subplot(2,2,1);
imshow(A);
subplot(2,2,2);
imshow(B);
subplot(2,2,3);
imshow(C);
subplot(2,2,4);
imshow(D);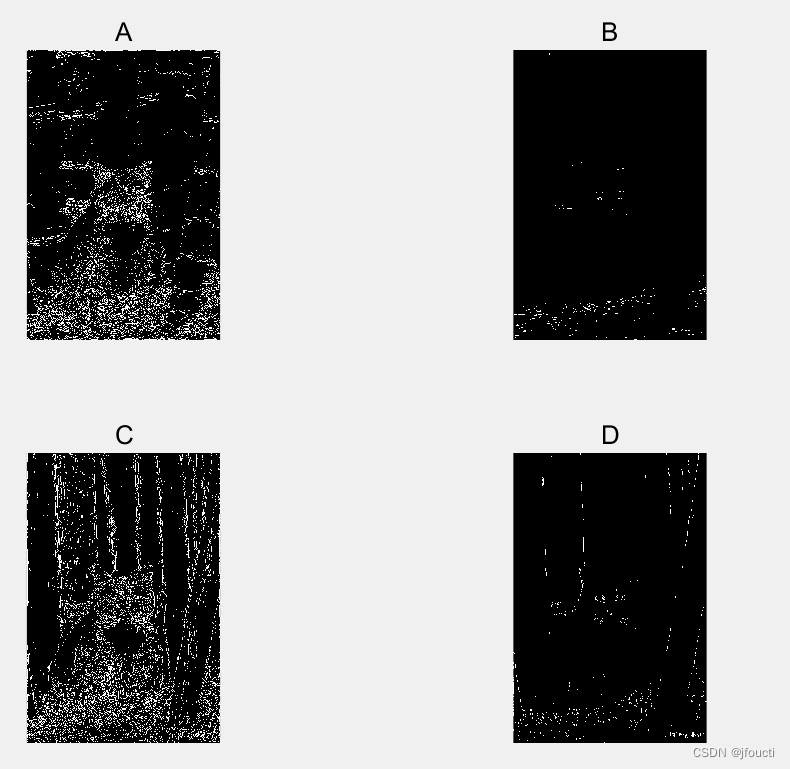
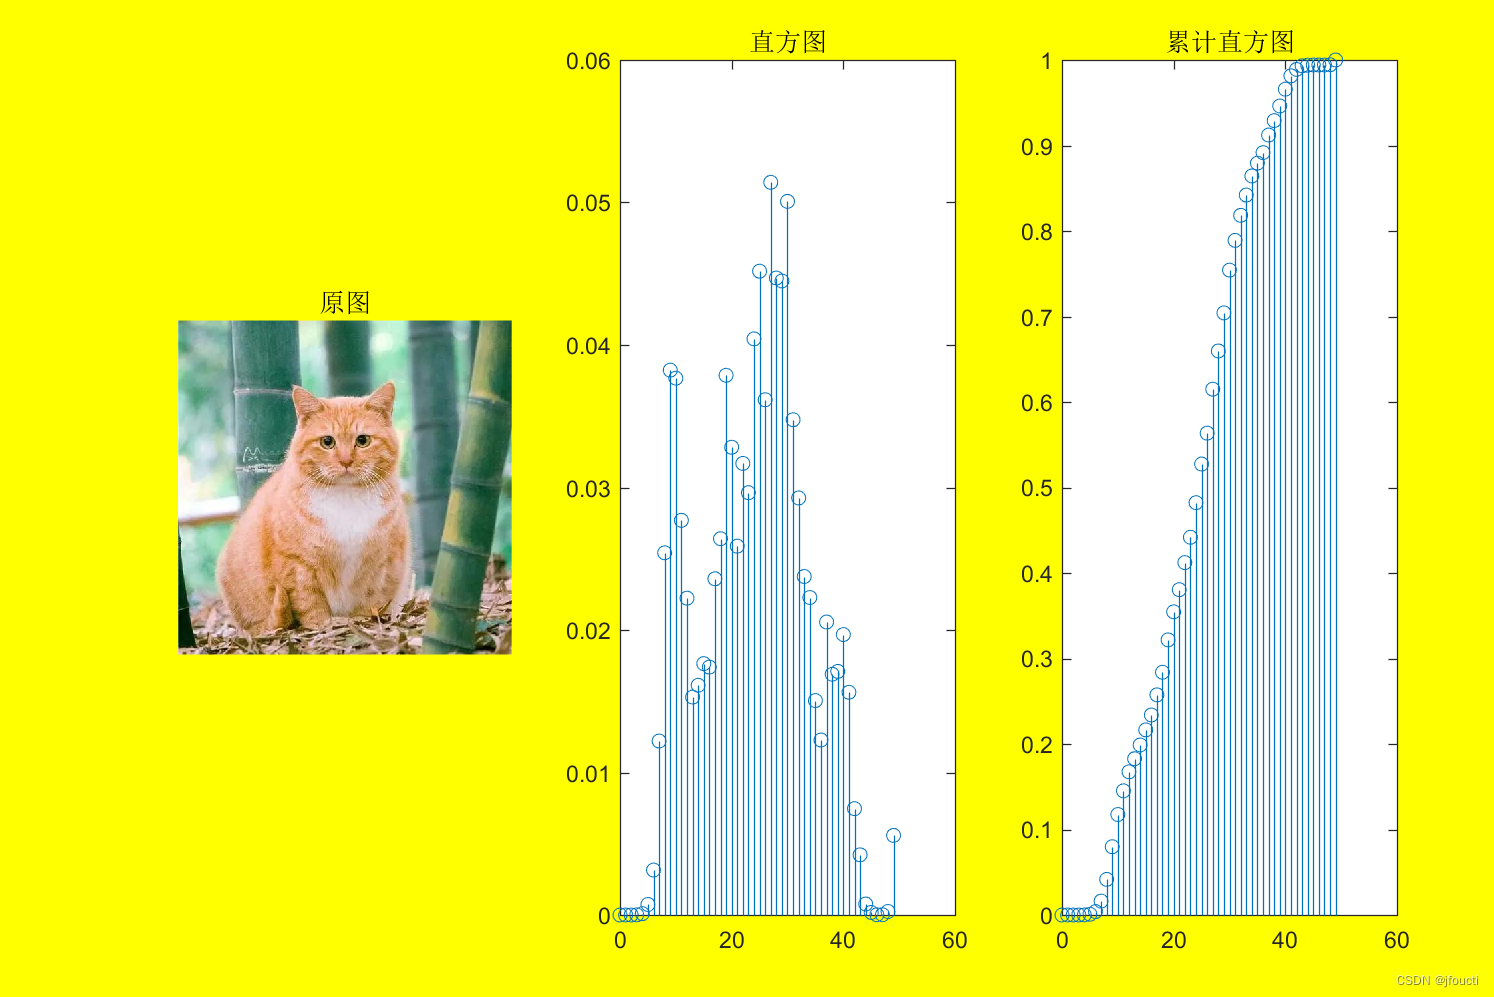
10. Normalized and cumulative histograms
I=imread('Cute cat.jpg');
set(gcf, 'Position', [20 70 900 600], 'color','y');
subplot(1,3,1),imshow(I),title(' original ')
N=50;
Hist_image=imhist(img_gray,N); % Calculate histograms
Hist_image=Hist_image/sum(Hist_image); % Calculate normalized histograms
Hist_image_cumulation=cumsum(Hist_image); % Calculate cumulative histograms
Subplot (1, 31), stem (0: N - 1, Hist_image), title (' histogram)
subplot(1,4,3),stem(0:N-1,Hist_image_cumulation),title(' cumulative histogram ')
Here for the secondary edit, the image is cropped to a square now.
set(gcf, 'Position', [20 70 900 600], 'color','y'); Set the figure position: start coordinates are (20 , 70 ), width is 900, height is 600 pixels.’ color’,’y’ sets the image background to yellow , default white. (‘r’ is red, ‘b’ is blue, ‘w’ is white)
11. Equalization of histograms
I=imread('Cute cat.jpg');
I_gray=rgb2gray(I);
subplot(2,4,1),imshow(I_gray),title('Original image')
subplot(2,4,5),imhist(I_gray),title('Original image histogram')
N=30;
g=histeq(I_gray,N); % histeq equalization function
subplot(2,4,2),imshow(g),title('Histogram equalized post image (N=30)')
subplot(2,4,6),imhist(g),title('Histogram after equalization (N=30)')
N=256;
g=histeq(I_gray,N); % histeq equalization function
subplot(2,4,3),imshow(g),title('Histogram equalized post image (N=256)')
subplot(2,4,7),imhist(g),title('Histogram after equalization (N=256)')
N=2048;
g=histeq(I_gray,N); % histeq equalization function
subplot(2,4,4),imshow(g),title('Histogram equalized post image (N=2048)')
subplot(2,4,8),imhist(g),title('Histogram after equalization (N=2048)')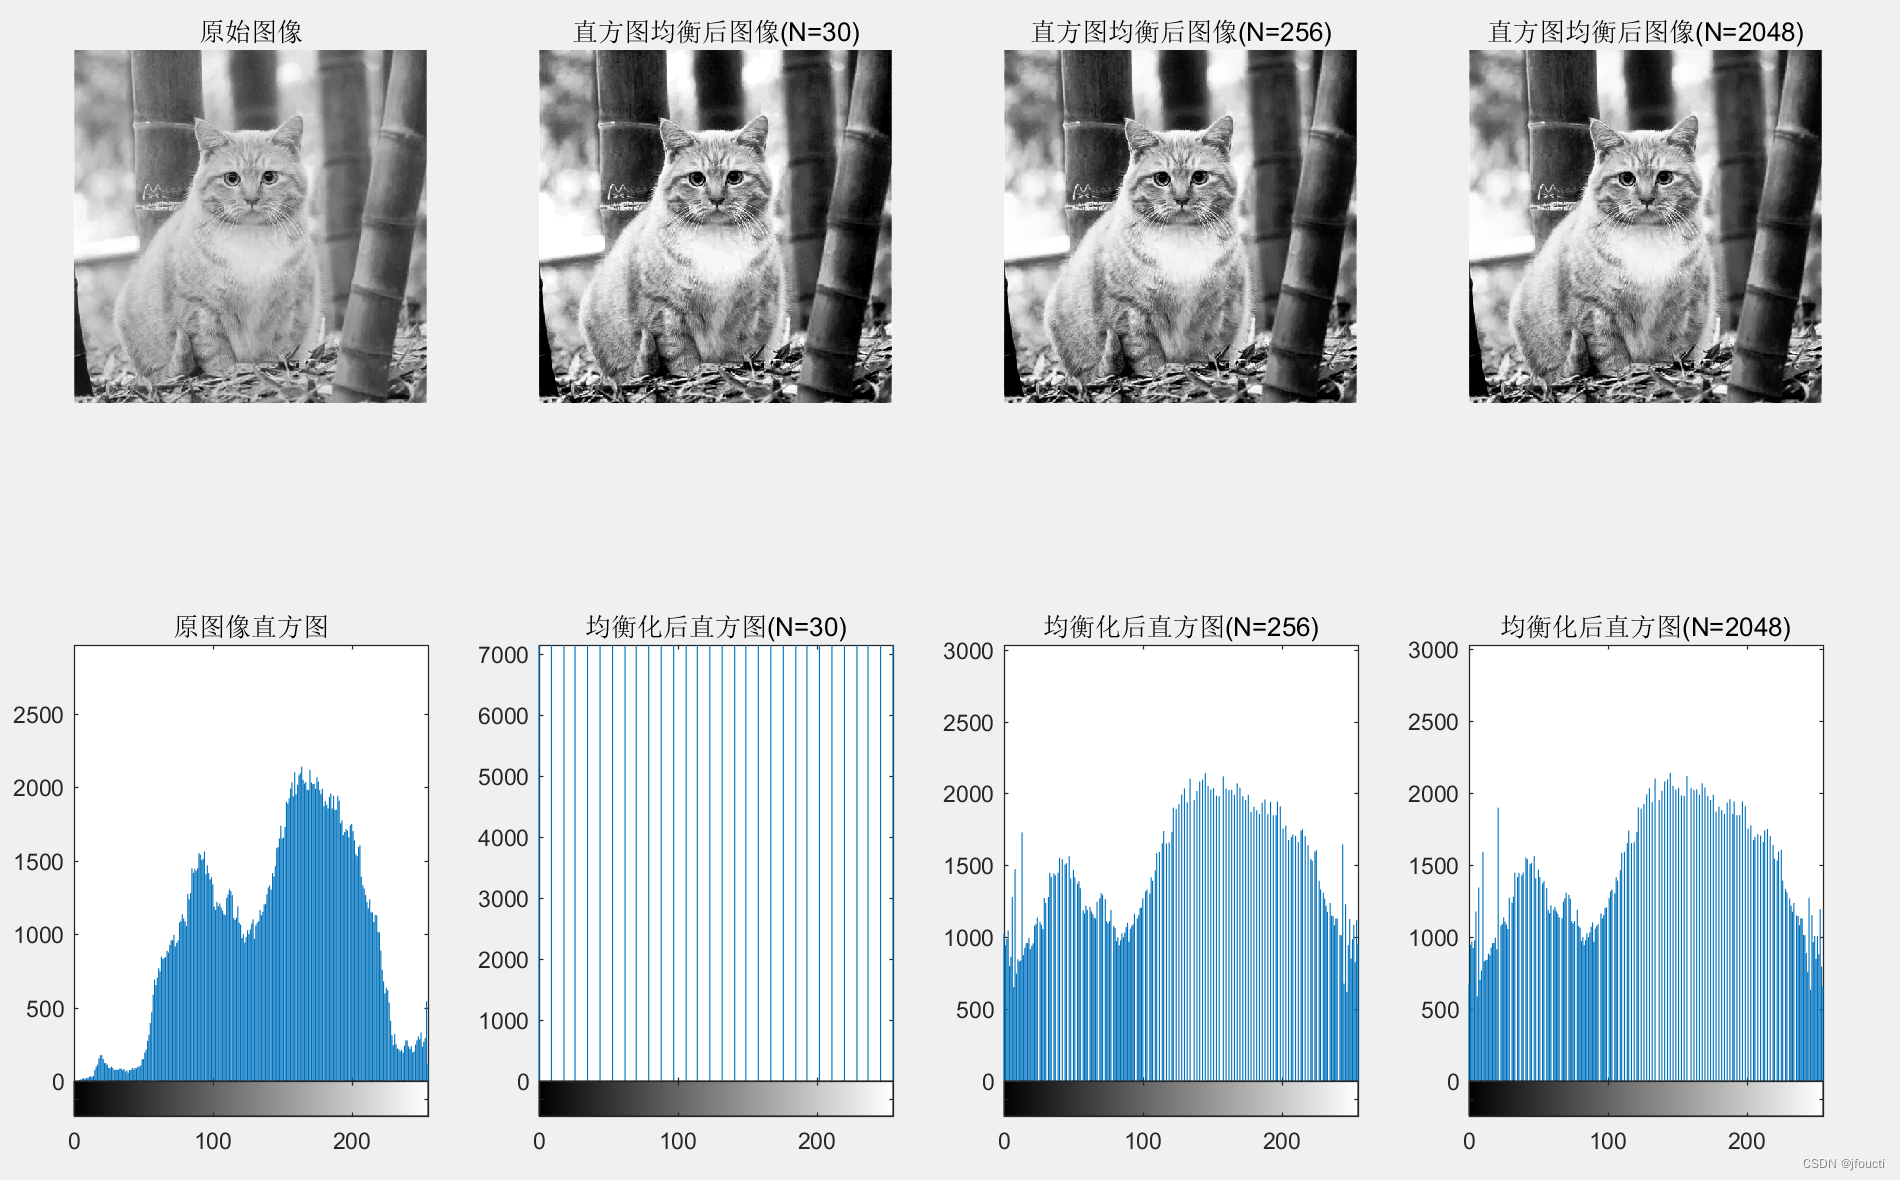 12 Prescriptive Histogram
I=imread('Cute cat.jpg');
I_gray=rgb2gray(I);
subplot(3,3,1),imshow(I_gray),title('Original image')
subplot(3,3,7),imhist(I_gray),title('Original image histogram')
% power function transformed histogram
Index=0:N-1;
Hist{1}=exp(-(Index-15).^2/8);  % 4
Hist{1}=Hist{1}/sum(Hist{1});
Hist_cumulation{1}=cumsum(Hist{1});
subplot(3,3,5),stem(0:N-1,Hist{1}),title('Power function transformed histogram')
% log function histogram
Index=0:N-1;
Hist{2}=log(Index+20)/60;  % 15
Hist{2}=Hist{2}/sum(Hist{2});
Hist_cumulation{2}=cumsum(Hist{2});
subplot(3,3,6),stem(0:N-1,Hist{2}),title('Log function transformed histogram')

% Prescriptive treatment
for m=1:2
    Image=I_gray;
    for k=1:N
        Temp=abs(Hist_image_cumulation(k)-Hist_cumulation{m});
        [Temp1, Project{m}(k)]=min(Temp);
    end
    % Transformed histogram
    for k=1:N
        Temp=find(Project{m}==k);
        if isempty(Temp)
            Hist_result{m}(k)=0;
        else
            Hist_result{m}(k)=sum(Hist_image(Temp));
        end
    end
    subplot(3,3,m+7),stem(0:N-1,Hist_result{m}),title('Transformed histogram')
    % Results chart
    Step=256/N;
    for k=1:N
        Index=find(I_gray>=Step*(k-1)&I_gray<Step*k);
        Image(Index)=Project{m}(k);
    end
    subplot(3,3,m+1),imshow(Image,[]),title('Transformed image')
end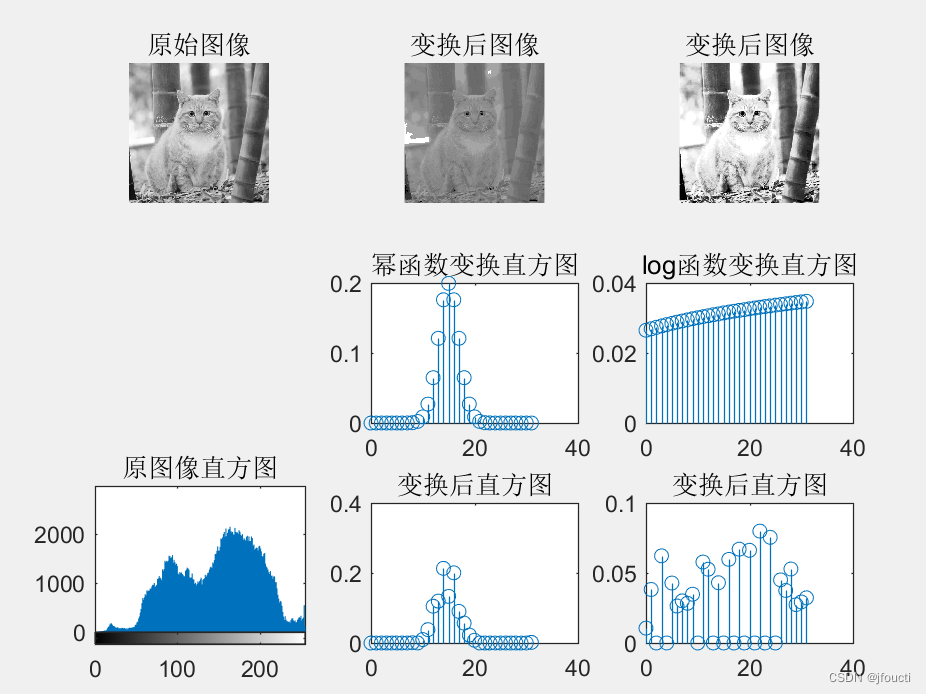
Continuously updated ……
