I. Preface
Hello! Ladies and Gentlemen, today I want to talk to you about using Python’s pandas to read data from an excel file.
Second, read Excel files
Using the pandasread_excel()method, which can be read directly from the file path. Note that in an excel file has more than one sheet, therefore, the excel file reading is actually reading the specified file, and at the same time specify the data under the sheet. You can read a sheet at a time, you can also read more than one sheet at a time, and read more than one sheet at the same time when the subsequent operation may not be convenient, so it is recommended to read only one sheet at a time.
When reading only a sheet, the return is of type DataFrame, which is a tabular data type that clearly shows the tabular structure of the data. Specifically written as:
(1) do not specify the sheet parameter, the default read the first sheet, the
df=pd.read_excel(“data_test.xlsx”)
(2) Specify the sheet name to read.
df=pd.read_excel(“data_test.xlsx”,sheet_name=”test1″)
(3) Specify the sheet index number to read.
df=pd.read_excel(“data_test.xlsx”,sheet_name=0) #sheet index number starts at 0
* Reads multiple sheets at the same time and returns them as a dictionary. (not recommended)
(1) Specify multiple sheet names to read, df=pd.read_excel(“data_test.xlsx”,sheet_name=[“test1”, “test2”])
(2) Specify multiple sheet index numbers to read.
df=pd.read_excel(“data_test.xlsx”,sheet_name=[0,1])
(3) Mixed specified sheet name and sheet index number reading, the
df=pd.read_excel(“data_test.xlsx”,sheet_name=[0,”test2″])
Click me to get a full set of software testing (automation testing) video materials for free (Remarks “Knowing AAA”)
III. Structure of the DataFrame object
Read the contents of the table header and no header in two ways, the default is the way the header, that is, the first line of elements are automatically set to the header label, the rest of the contents of the data; when in the read_excel () method with header = None parameter when the header is not added to the way, that is, from the first line, all the contents of the data. Read Excel data are constructed and returned to the DataFrame table type (hereinafter referred to as df).
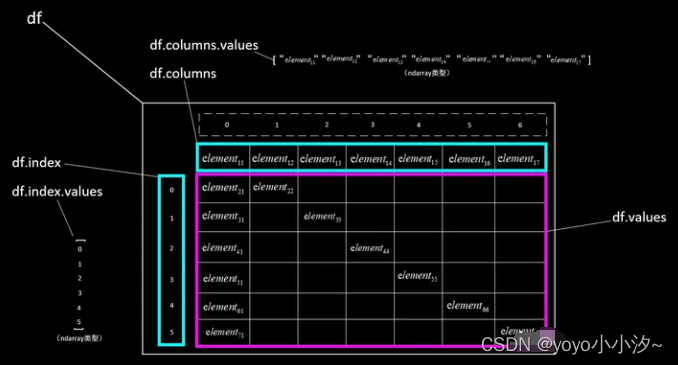
For the way with table header, the first row element will be automatically set as the header vector when reading, and at the same time, row index (starting from 0) and column index (starting from 0) will be added for each row content except the header. As shown in the figure

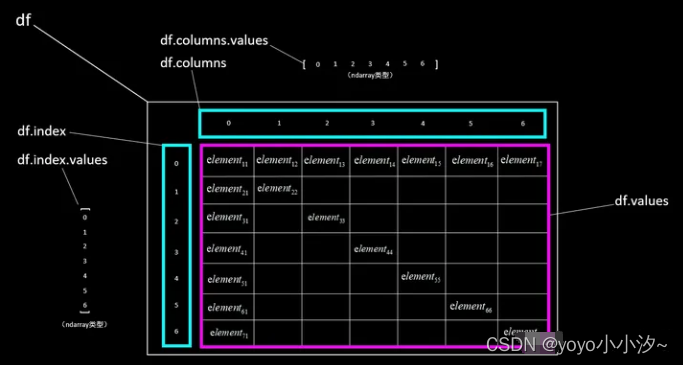
For the way without table header, when reading, it will automatically add row index (starting from 0) for each row and column index (starting from 0) for each column, and the row index will start from the first row. As shown in the figure

IV. Getting data with VALUES
1. Basic methodology
df.values, get all data, return type ndarray (two-dimensional);
df.index.values, get row index vector, return type ndarray (one-dimensional);
df.columns.values, get the column index vector (for the way with table headers, it is the header label vector), return type is ndarray (one-dimensional).
The specified data is acquired by using the rules of ndarray according to the specific needs. The structure of data acquisition is shown below.
tabulated
meterless
2. Get the specified data write
(1) Access to all data:
df.values, get all data, return type ndarray (two-dimensional).
(2) Get a certain value:
df.values[i , j], the value of the i-th row and j-th column, the return type depends on the content.
(3) Get a particular line:
df.values[i], the ith row of data, return type ndarray (one-dimensional).
(4) Get multiple lines:
df.values[[i1 , i2 , i3]], row i1, i2, i3 data, return type ndarray (two-dimensional).
(5) Get a column:
df.values[: , j], the jth column of data, return type ndarray (one-dimensional).
(6) Get multiple columns:
df.values[:,[j1,j2,j3]], column j1, j2, j3 data, return type ndarray (two-dimensional).
(7) Getting slices:
df.values[i1:i2 , j1:j2], return row number [i1,i2), column number [j1,j2) left-closed right-open interval within the data, the return type is ndarray (two-dimensional).
3. Examples
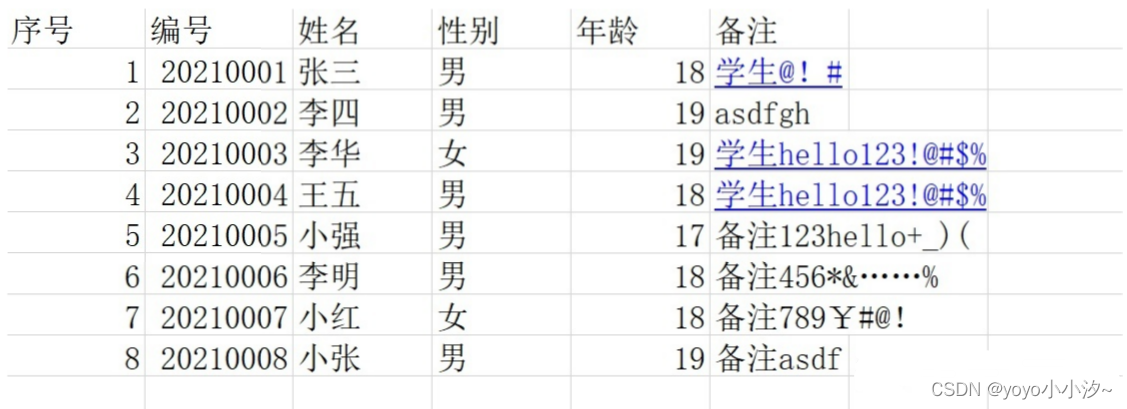
With table headers, the excel content is
The Python script is
`import pandas as pd
df = pd.read_excel(“data_test.xlsx”)
print(“\n(1) all data:”)
print(df.values)
print(“\n(2) Value of row 2, column 3:”)
print(df.values[1,2])
print(“\n(3) line 3 data:”)
print(df.values[2])
print(“\n(4) Getting the 2nd and 3rd rows of data:”)
print(df.values[[1,2]])
print(“\n(5) column 2 data:”)
print(df.values[:,1])
print(“\n(6) columns 2 and 3 data:”)
print(df.values[:,[1,2]])
print(“\n(7) rows 2 to 4, columns 3 to 5 data:”)
print(df.values[1:4,2:5])
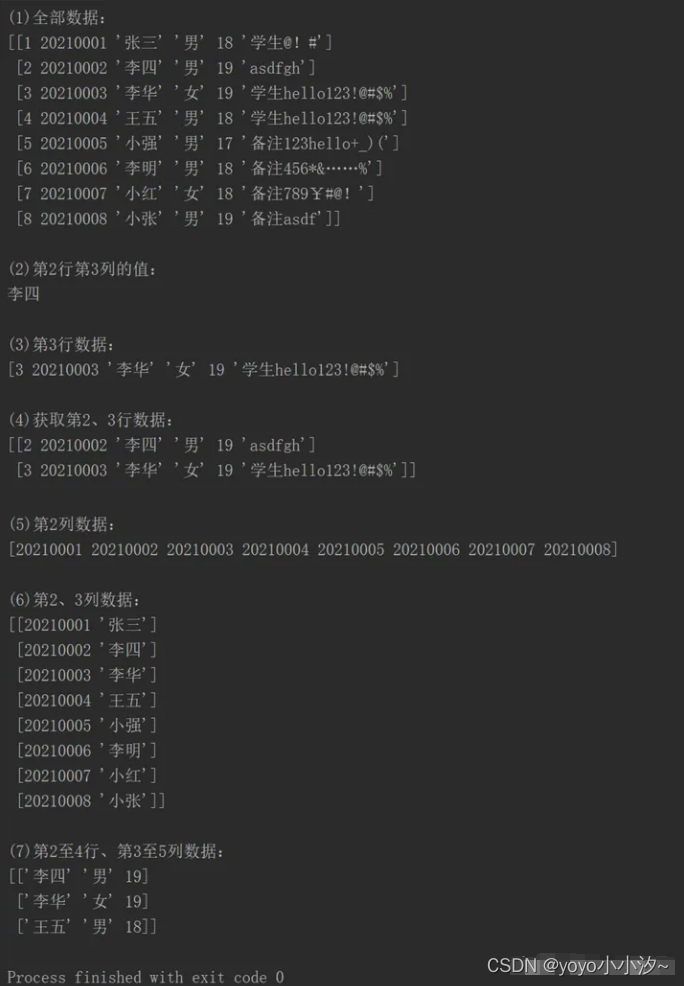
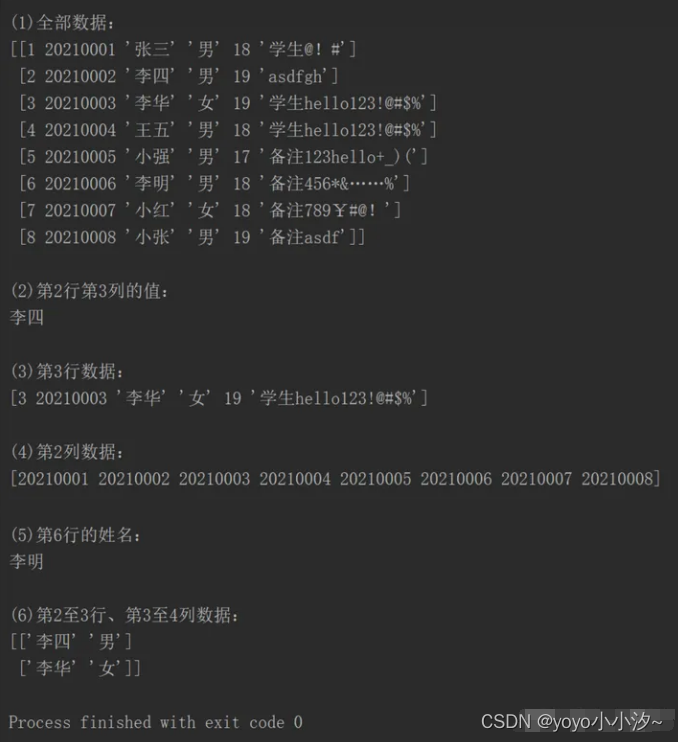
Implementation results
V. Getting data in loc and iloc mode
1. Basic writing style
loc and iloc methods are indexed to locate the way to get the data, written as loc[A, B] and iloc[A, B]. Where A represents the index on the rows, B represents the index on the columns, B can be default. A, B can be a list or i1:i2 (sliced) form, indicating multiple rows or columns.
The difference between these two approaches is that loc treats arguments as labels and iloc treats arguments as index numbers. That is, in the way with table headers, only loc is available when column indexes use str labels, and only iloc is available when column indexes use index numbers; in the way without table headers, index vectors are also label vectors, and both loc and iloc can be used; and in slicing, loc is a closed interval and iloc is a half-open interval.
Get the write method for the specified data:
(1) Access to all data:
df.loc[: , :].values
maybe
df.iloc[: , :].values with return type ndarray (two-dimensional).
(2) Get a certain value:
meterless
df.loc[i, j]
maybe
df.iloc[i, j], the value of row i, column j. The return type depends on the content.
tabulated
df.loc[i, “serial number”], the value of the ‘serial number’ column in row i.
maybe
df.iloc[i, j], the value of row i, column j.
(3) Get a particular line:
df.loc[i].values
maybe
df.iloc[i].values, the ith row of data, return type ndarray (one-dimensional).
(4) Get multiple lines:
df.loc[[i1, i2, i3]].values,
maybe
df.iloc[[i1, i2, i3]].values, data for rows i1, i2, i3, return type ndarray (two-dimensional).
(5) Get a column:
meterless
df.loc[:, j].values
maybe
df.iloc[:, j].values, jth column of data, return type ndarray (one-dimensional).
tabulated
df.loc[:, “name”].values, ‘name’ column data, return type ndarray (one-dimensional).
maybe
df.iloc[:, j].values, jth column of data, return type ndarray (one-dimensional).
(6) Get multiple columns:
meterless
df.loc[:, [j1 , j2]].values
maybe
df.iloc[:, [j1 , j2]].values, columns j1, j2 data, return type ndarray (two-dimensional).
tabulated
df.loc[:, [“name”, “gender”]].values, data for columns ‘name’, ‘gender’, return type ndarray (two-dimensional);
df.iloc[:, [j1 , j2]].values, columns j1, j2 data, return type ndarray (two-dimensional).
(7) Getting slices:
meterless
df.loc[i1:i2, j1:j2].values, return row number [i1,i2], column number [j1,j2] within the closed interval of the data, the return type is ndarray (two-dimensional);
df.iloc[i1:i2, j1:j2].values, return row number [i1,i2), column number [j1,j2) left-closed-right-open interval within the data, the return type is ndarray (two-dimensional).
tabulated
df.loc[i1:i2, “Serial Number”: “Name”].values, return row number [i1,i2], column number [“Serial Number”, “Name”] closed interval of the data, the return type is ndarray (two-dimensional);
df.iloc[i1:i2, j1:j2].values, return row number [i1,i2), column number [j1,j2) left-closed-right-open interval within the data, the return type is ndarray (two-dimensional).
2. Examples
With table headers, the excel content is
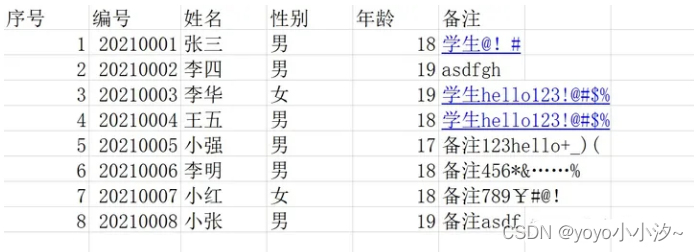
The Python script is
`import pandas as pd
df = pd.read_excel(“data_test.xlsx”)
print(“\n(1) all data:”)
print(df.iloc[:,:].values)
print(“\n(2) Value of row 2, column 3:”)
print(df.iloc[1,2])
print(“\n(3) line 3 data:”)
print(df.iloc[2].values)
print(“\n(4) column 2 data:”)
print(df.iloc[:,1].values)
print(“\n(5) Name in line 6:”)
print(df.loc[5, “name”])
print(“\n(6) rows 2-3, columns 3-4 data:”)
print(df.iloc[1:3,2:4].values)`
Implementation results
Finally: In order to give back to the hardcore fans, I have organized a complete software testing video learning tutorials, friends if you need to get their own free![Guaranteed 100% free]
How to get the full set of information: click on the small card below to get it by yourself

